An employee survey methodology you can trust
Empuls (a product by Xoxoday) is built on established employee-engagement research, developed in consultation with the Society for Human Resource Management (SHRM), the world's largest HR professional body, along with other consulting agencies in the employee engagement space. The survey models draw from widely adopted engagement frameworks, listed below.
Survey effectiveness, design testing, bias testing, pilot testing, and statistical validation were carried out on a representative sample via SHRM. We continue to refine survey design based on client feedback gathered over many years. Capabilities such as benchmarking, survey-fatigue management, AI-led surveys, reporting enhancements, survey communication & launch, and conversational surveys have all been introduced through these customer inputs.
The methodology and questionnaires draw on the following models, delivered through different survey types within the platform.

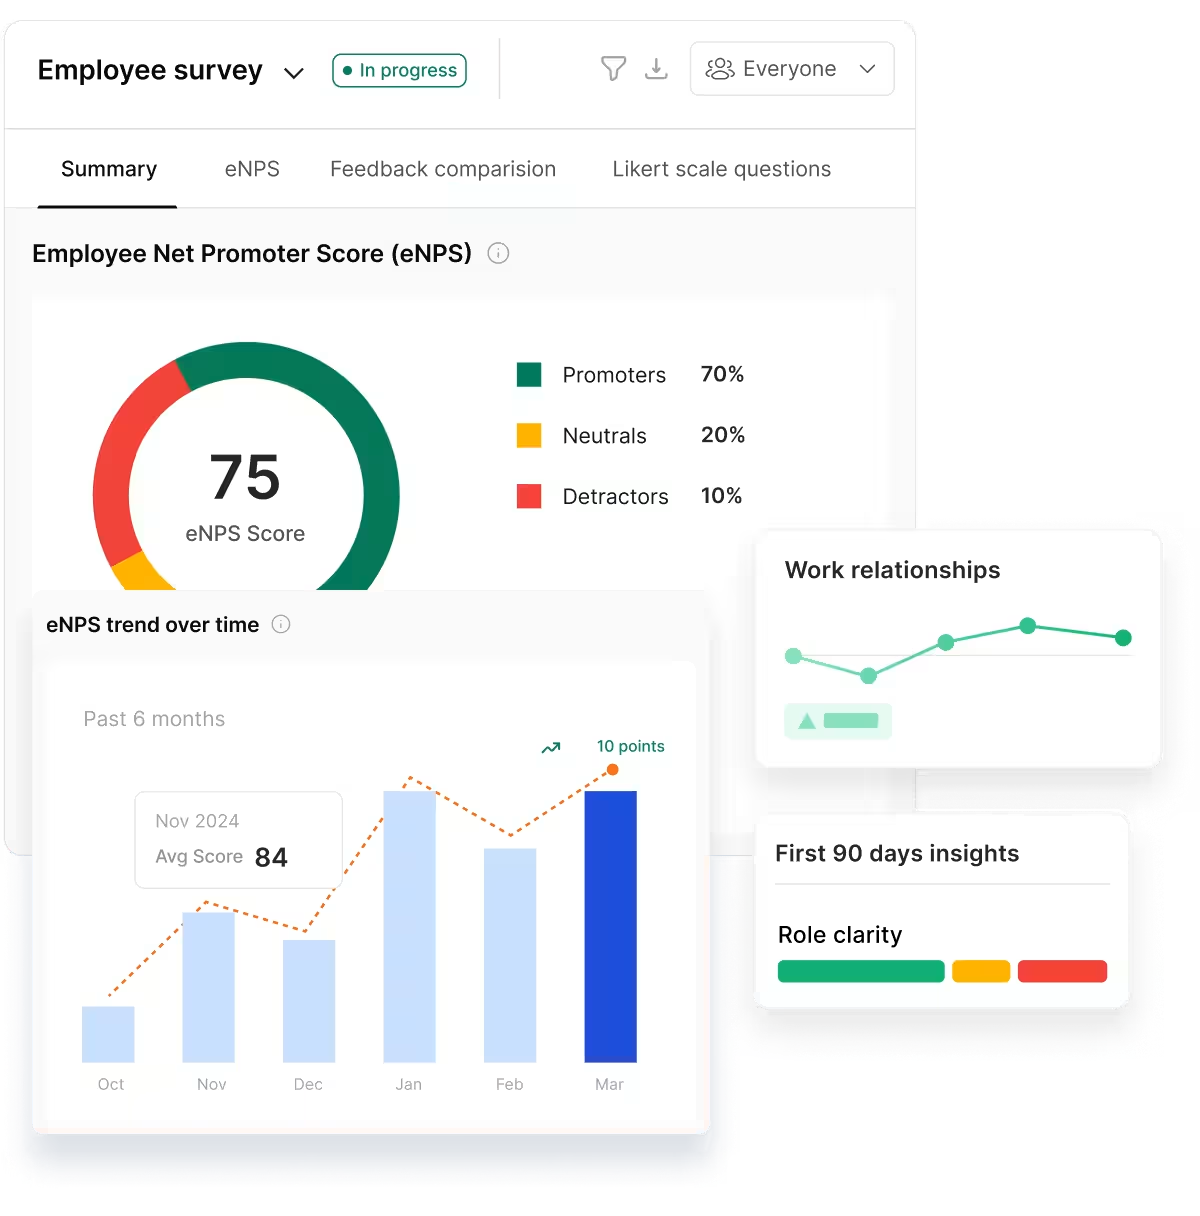
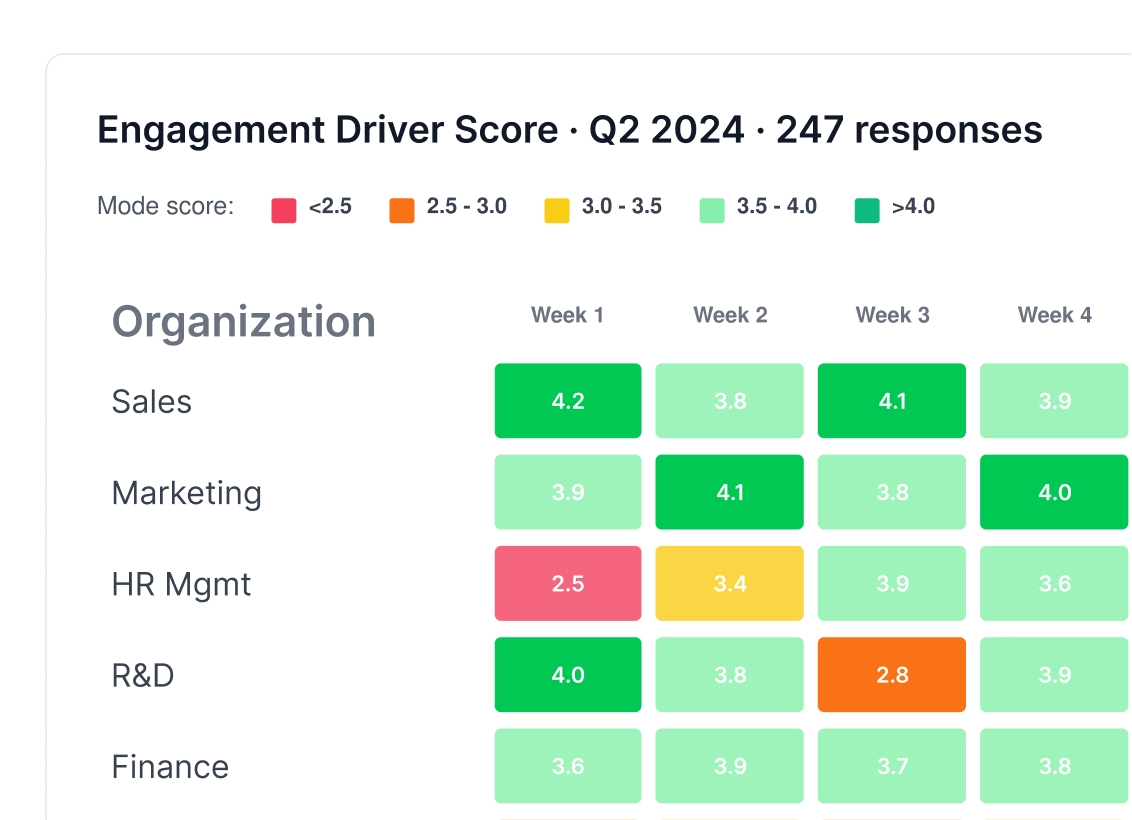
Deming PDCA cycle in Empuls surveys
The PDCA (Plan, Do, Check, Act) cycle, originated by Walter Shewhart and popularized by W. Edwards Deming, is one of the strongest frameworks for structuring employee surveys. The most common criticism of engagement surveys is not the survey itself, it is the failure to act on the results. PDCA addresses exactly that. Empuls brings modules beyond surveys into the platform to complete the PDCA cycle and connect the dots.
| PDCA stage | Empuls capability |
|---|---|
| Plan | AI recommends survey templates, questions, target audience, and timing. |
| Do | Multi-channel survey delivery via web, mobile, Teams, Slack, and email, with automated reminders. |
| Check | Identifies key engagement drivers, summarizes comments, benchmarks teams, and predicts attrition risk. |
| Act | Generates action plans, assigns owners, and recommends recognition, benefits, coaching, or policy changes. |
AON Hewitt's Say-Stay-Strive model
The Say-Stay-Strive model measures employee engagement across three observable behaviors.
Say
Employees speak positively about the organization.
Measures advocacy
Stay
Employees want to remain with the organization.
Measures retention
Strive
Employees are willing to go above and beyond in their work.
Measures performance
The questionnaire covers the fundamentals of engagement through the following drivers and sub-drivers.
| Driver (behavior measured) | Sub-drivers |
|---|---|
| Leadership (Say, Stay) | Senior leadership, vision, trust in leadership, ethics, communication, confidence in the future |
| Manager (all three) | Coaching, feedback, recognition, support, fairness, communication, development |
| Work (Strive) | Meaningful work, autonomy, role clarity, empowerment, workload, innovation |
| Career opportunities (Stay, Strive) | Career path, internal mobility, learning, skill development, promotions |
| Recognition & rewards (Say, Strive) | Appreciation, pay fairness, incentives, benefits, performance recognition |
| People (all three) | Teamwork, collaboration, respect, inclusion, diversity, belonging |
| Performance management (Stay, Strive) | Goal setting, continuous feedback, performance reviews, accountability |
| Organization practices (Say, Strive) | Communication, decision-making, agility, customer focus, processes |
| Quality of life / wellbeing (Stay, Strive) | Work-life balance, flexibility, wellbeing, psychological safety, health |
| Employer brand (Stay) | Pride, reputation, purpose, social responsibility, values |
Statistical validation
The questionnaire has been validated to ensure reliability and effectiveness. A Cronbach's Alpha above 0.80 indicates strong internal consistency, so the score below reflects a robust instrument.
| Metric | Score | What it indicates |
|---|---|---|
| Cronbach's Alpha (reliability) | 0.82 | Strong internal consistency across engagement constructs |
| Test-retest reliability (correlation) | 0.78 | Stable scores across repeated pulse surveys |
| Correlation: engagement vs. attrition | r = -0.45 | Moderate negative correlation, higher engagement, lower attrition |
Employee Net Promoter Score (eNPS) surveys
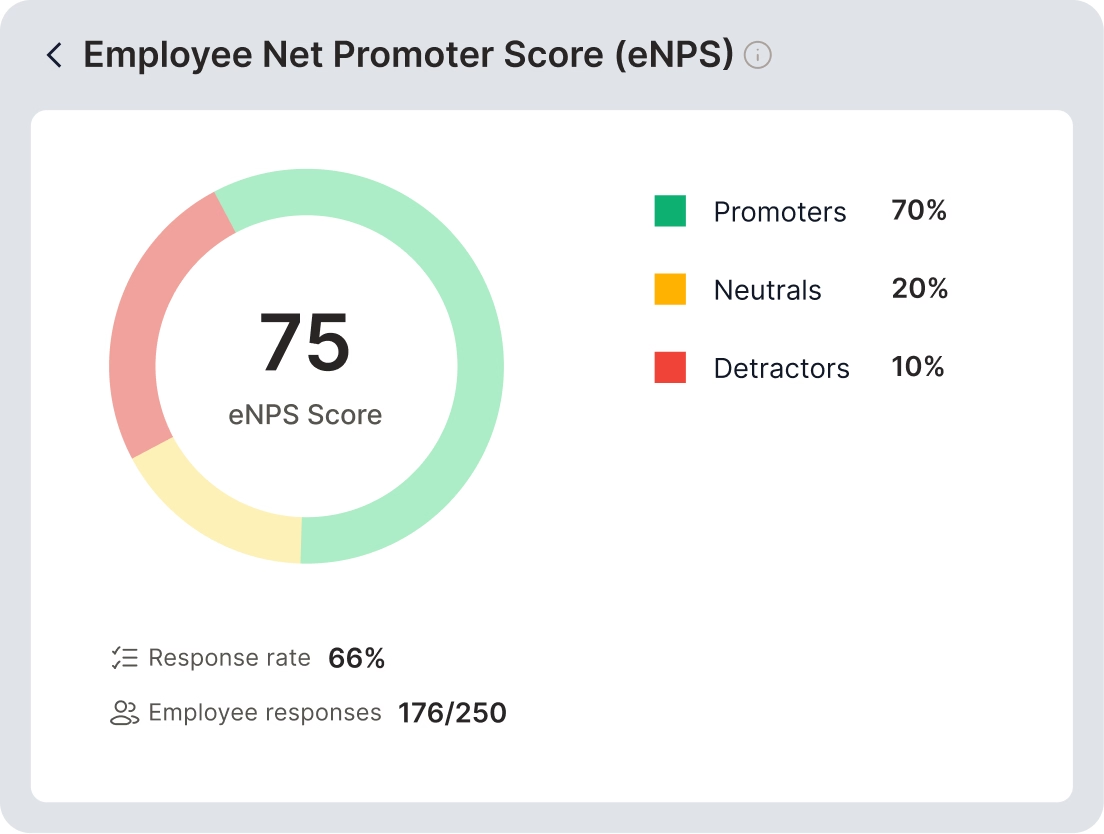
eNPS is a simple, widely used metric that measures employee loyalty and advocacy, adapted from the Net Promoter Score framework created by Fred Reichheld at Bain & Company.
The core question
“How likely are you to recommend this organization as a great place to work?”, on a 0 to 10 scale.
It is often followed by a detailed survey to explore the drivers behind the score.
Employee lifecycle surveys
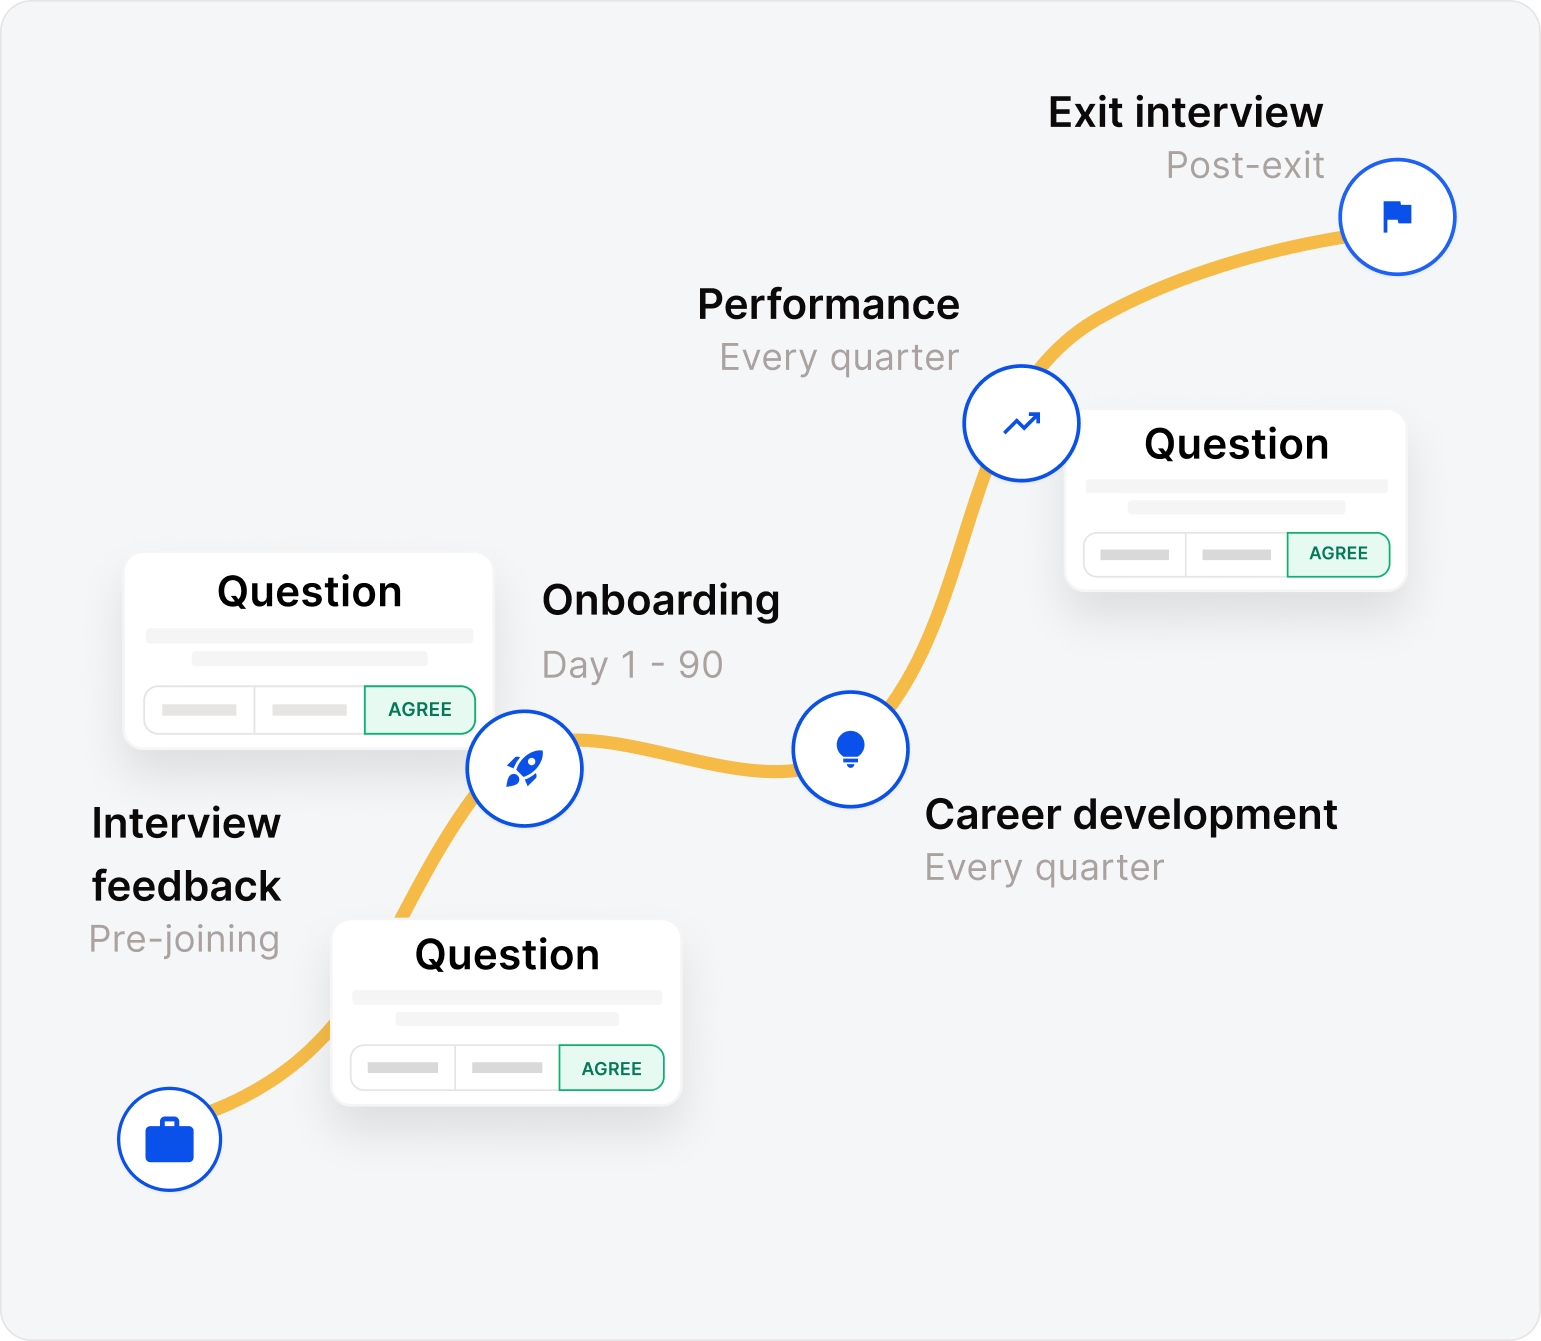
Rather than relying on a single annual survey, feedback is collected throughout the employee journey, from hiring and onboarding through manager effectiveness, L&D, DEI, wellbeing, and exit. This creates a continuous listening system instead of a once-a-year snapshot.
Lifecycle surveys can run in the traditional way or through our always-on continuous-listening agent. The agent triggers conversational touchpoints at key moments (joining, anniversaries, promotions, exits) and uses AI to classify responses into drivers, sentiment, and engagement buckets (Engaged, Fence-sitter, Disengaged) for early risk identification. This feeds directly into a case-management and action-plan workflow, so HR can close the loop in near real-time rather than waiting for the next survey cycle.
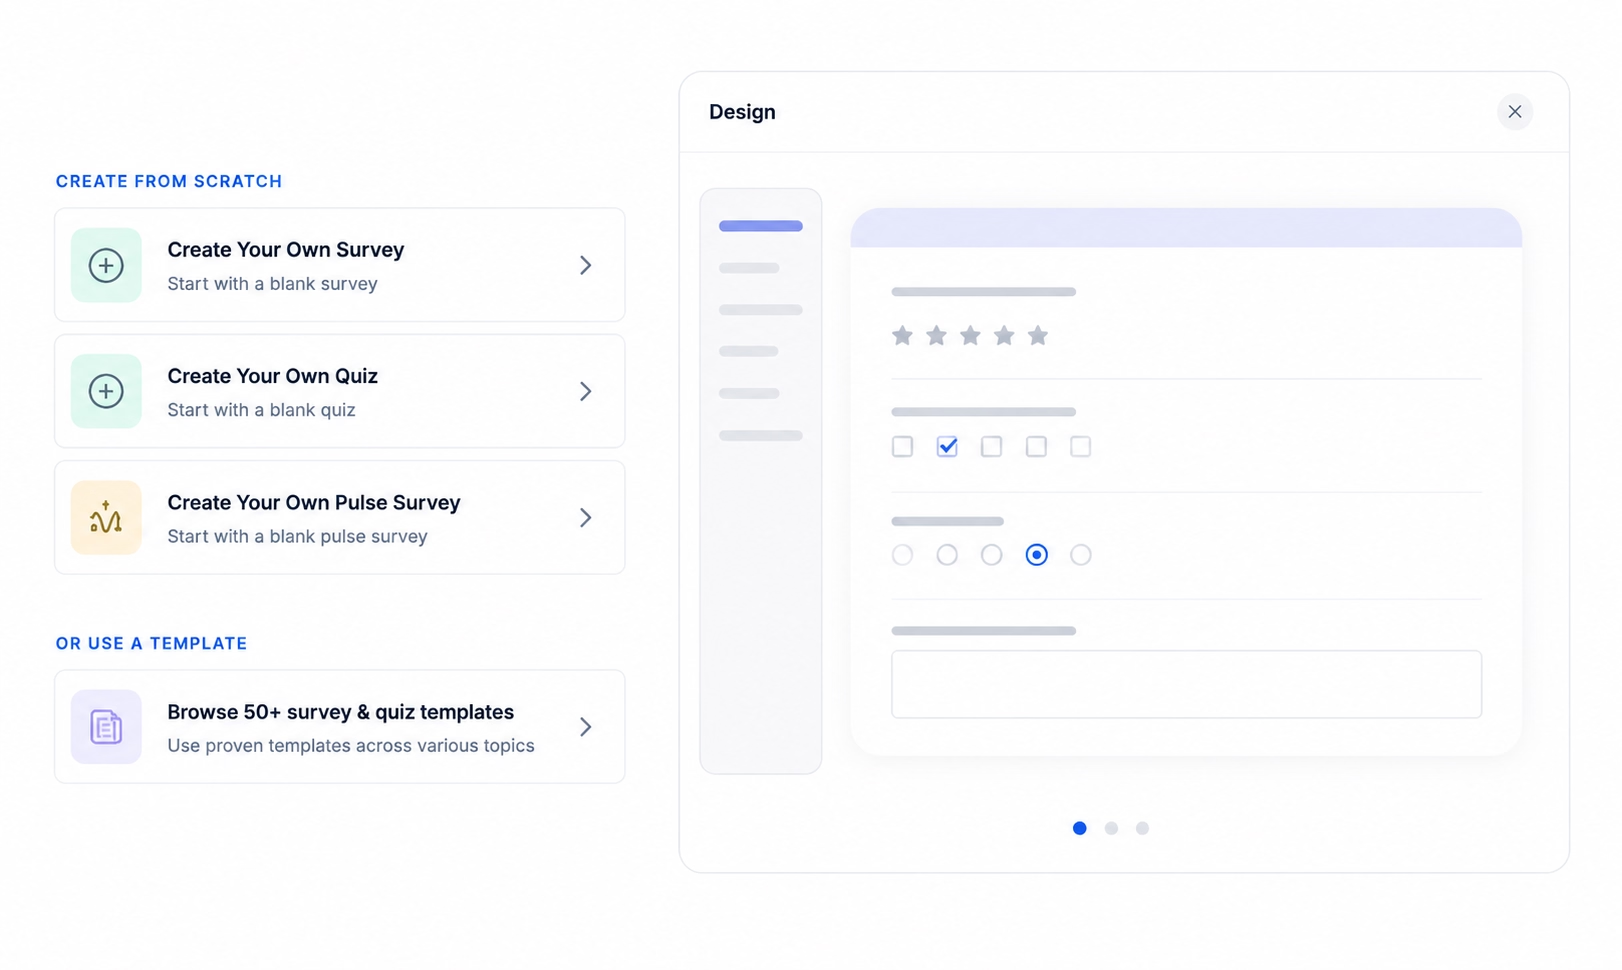
Custom survey templates
The platform gives HR full flexibility to create its own surveys or apply any other survey methodology. Custom surveys do not carry a pre-built Empuls scoring algorithm, because the design is the customer's own, the analysis is owned and interpreted by the HR team.
Survey integrity & governance
Trustworthy data depends on how surveys are run, not just which model is used. Empuls applies the following safeguards across every survey type. Configurations are available to change these settings.
Anonymity & confidentiality
Individual responses are kept confidential and are never attributed to a named employee; results are shared only in aggregate.
Minimum reporting threshold
Results for any group are shown only when the group meets a minimum response count (commonly five or more), protecting individual anonymity in small teams.
Scoring methodology
Engagement items are captured on a Likert scale and reported as percentage favorable, neutral, and unfavorable, alongside mean scores; eNPS uses the standard 0 to 10 promoter/passive/detractor calculation.
Benchmarking
Scores can be compared internally (team, department, over time) and externally against industry benchmarks to give context to every number.
Survey-fatigue management
Frequency governance and question rotation prevent over-surveying and protect response quality and participation rates.
Want the full methodology brief as a PDF?
Download this page for sharing with your HR or leadership team.