Key Takeaways
41% of loyalty leaders cannot quantify program impact because they measure total member revenue, not incremental revenue tied to behavioral change
A loyalty program ROI case that survives CFO scrutiny uses a control group, a full cost model, and a scenario range-not a single optimistic number
Redemption rate is the leading indicator: when members stop redeeming, incremental revenue follows within one to two quarters
Your CFO has one question. Not about redemption rates or active member counts. Just this: is the loyalty program making more money than it costs?
Most CMOs cannot answer that with confidence. They have dashboards full of engagement metrics, but when the budget conversation comes around, those numbers do not add up to a business case. The EY 2024 Loyalty Market Study found that 41% of corporate loyalty leaders report challenges with quantifying their overall program impact. That is nearly half the industry running a program it cannot defend.
This guide gives you the framework to change that: the ROI formula, the metrics that carry weight with finance teams, the costs you are likely underestimating, and how to present the whole picture in a way that survives a CFO's scrutiny.
Why Loyalty Program ROI Is Genuinely Hard to Measure
The core problem is not math. It is attribution.
Your best customers are also the most likely to join your loyalty program. A retail bank running a card rewards program will naturally attract its highest spenders as members. When those customers then spend more, how much of that increase came from the program, and how much would have happened anyway?
Measuring loyalty member revenue against non-member revenue answers the wrong question. It tells you who your best customers are, not whether the program changed their behavior. The EY 2024 Loyalty Market Study calls this the "chicken or the egg" problem, and it is why finance teams push back on loyalty ROI presentations that simply compare member and non-member totals.
The fix is incrementality: isolating revenue that would not have existed without the program. That requires a comparison method, either a pre-and-post analysis of customer behavior before and after enrollment, or a control group of matched non-members. Without one of these, your ROI calculation is measuring selection bias, not program impact. For a broader view of what a well-run program looks like from the ground up, the customer loyalty program guide covers the structural decisions that make measurement possible.
The Loyalty Program ROI Formula: What You Are Actually Calculating
The formula is simple. Applying it correctly is not.
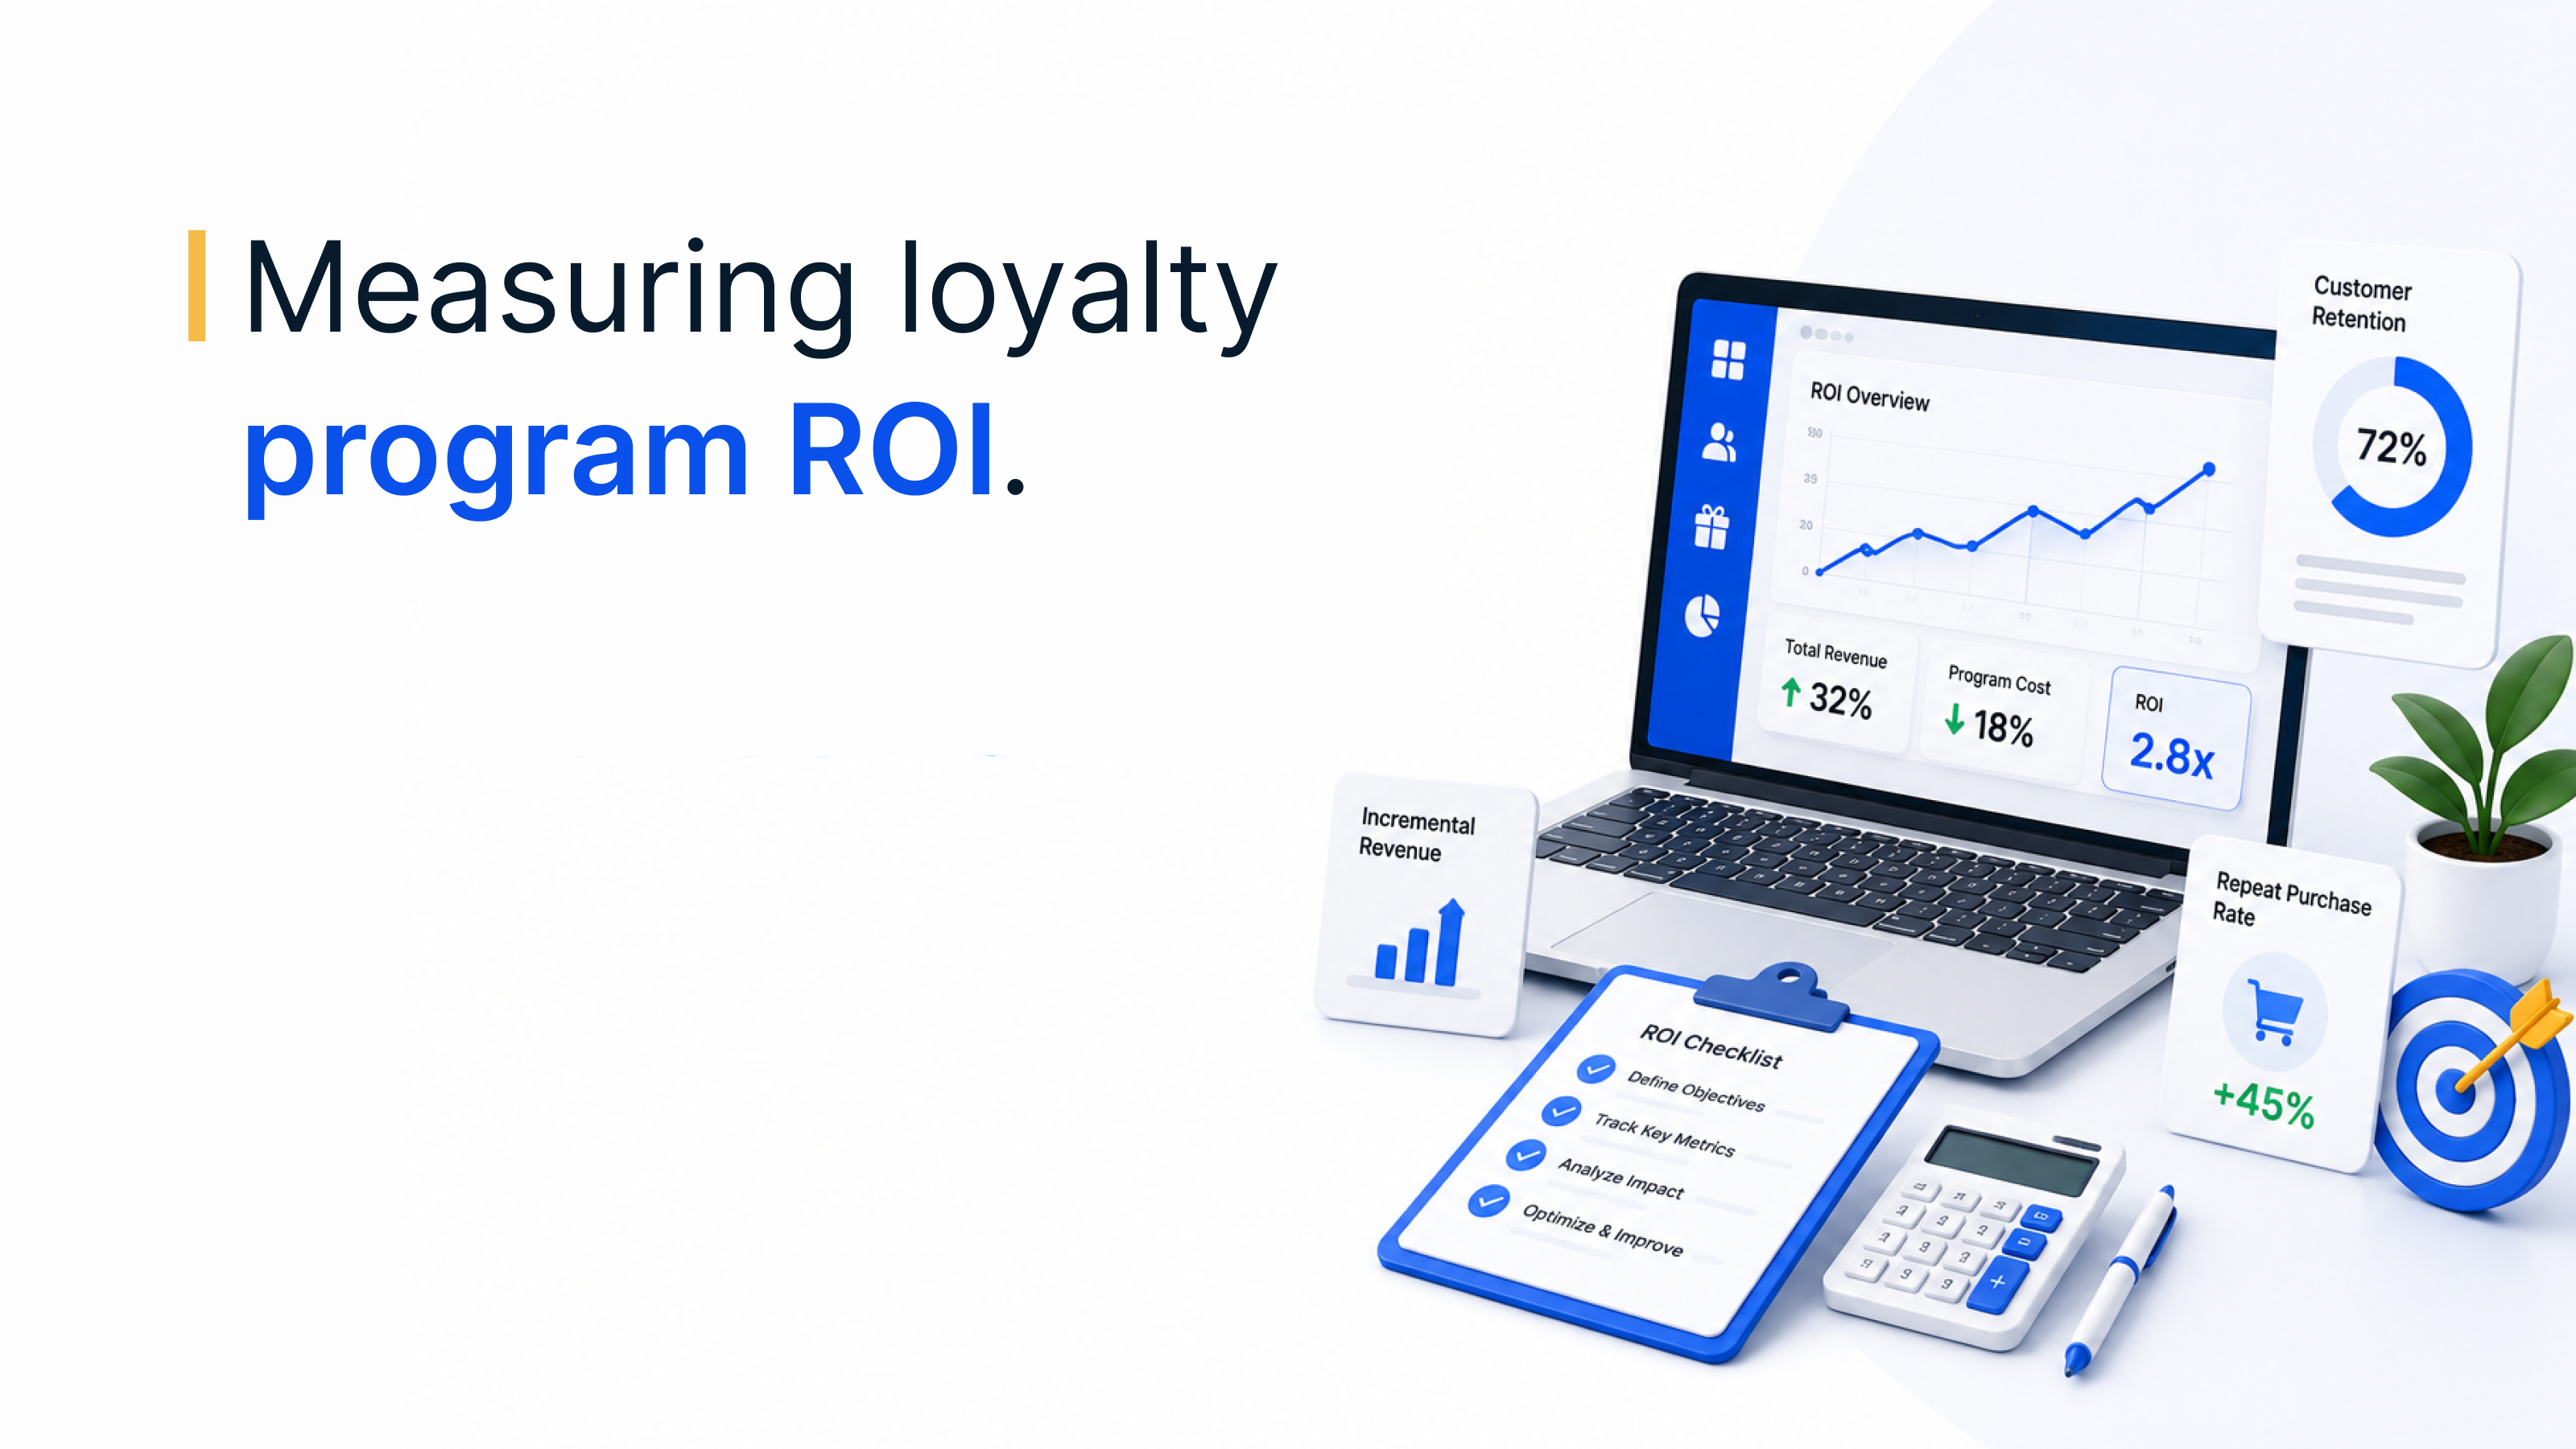
ROI = (Incremental Net Profit / Total Program Cost) × 100
The word "incremental" in the numerator is doing all the work. It means revenue generated because of the program, not total revenue from enrolled members. Start with the average revenue per customer before enrollment. Measure it again for the same cohort after enrollment. The difference, multiplied by the number of enrolled members, is your incremental revenue. Apply your average margin to get incremental profit. Divide by total program cost. Multiply by 100.
According to Harvard Business Review analysis, companies that run loyalty programs generate revenues 2.5 times faster and achieve significantly higher ROI than competitors without programs. The range in outcomes comes down almost entirely to how "incremental" is defined in the numerator and how completely costs are captured in the denominator. The next two sections address both.
The 6 Loyalty Program KPIs That Build a Defensible ROI Case
ROI is the headline number. These six metrics are the evidence behind it.
| KPI | What it measures | Why it matters to finance | Benchmark signal |
|---|---|---|---|
| Customer Lifetime Value (CLV) | Long-term revenue per member vs. non-member | Proves the program creates higher-value customers | Members should show 25–30% higher CLV (Harvard Business Review) |
| Repeat Purchase Rate | How often members return vs. non-members | Shows behavioral change, not just reward collection | Measurable lift above non-member baseline in same category |
| Redemption Rate | Points redeemed as % of points issued | Leading indicator of engagement and reward relevance | 48–65% is healthy; below 20% signals reward design issues |
| Average Order Value (AOV) | Spend per transaction for members vs. non-members | Measures whether rewards encourage larger basket sizes | Positive AOV lift vs. non-member baseline |
| Purchase Frequency | Number of transactions per member per period | Shows whether the program drives visit cadence | Above non-member baseline in same category |
| Incremental Sales Lift | (Member revenue − baseline revenue) / baseline | The direct behavioral impact of the program on revenue | Positive and growing quarter-over-quarter |
According to Accenture, loyalty program members generate 12–18% more incremental revenue per year than non-members. The gap between enrolled members and active redemption members is where most programs lose value: members who actually use their rewards spend 3.1 times more annually than those who enroll and never redeem, according to Netguru's 2026 loyalty ROI research.
The main goals tracked by 100+ loyalty experts in 2024 were improving CLV (56%), lowering churn (49%), and increasing purchase frequency (45%), according to Open Loyalty. Each maps directly to one of the KPIs above. If your reporting does not cover all three, your business case has gaps a finance team will find. For how loyalty market data can sharpen your KPI selection, see what loyalty market research looks like in practice.
See your loyalty program's true ROI
Loyalife's analytics layer surfaces CLV comparison between members and matched non-members, so you can prove program impact to your finance team with confidence.
Book a demoTrusted by 5,000+ companies
What a Loyalty Program Actually Costs: Direct and Hidden Expenses
Most programs undercount costs. That makes ROI look stronger than it is, which then creates a different problem when the CFO audits the numbers.
Direct costs (typically budgeted):
- Rewards and redemption value (discounts, gift cards, experiential rewards)
- Technology platform fees (licensing, implementation, integrations with CRM and CDP)
- Marketing and campaign costs (enrollment promotion, member communications)
- Program management and staffing
Indirect costs (frequently omitted):
- Points liability: unredeemed points are a financial obligation on your balance sheet. Most programs provision 65–70% of issued points as breakage, but the remaining liability must be tracked and reported (Brandmovers, 2026).
- Data management: loyalty programs collect behavioral data at scale. Storing, protecting, and governing that data has a cost that grows with program volume.
- Customer support overhead: member inquiries, redemption disputes, and enrollment issues are a real and ongoing cost.
- Fraud prevention: points gaming and synthetic member fraud require active monitoring and tooling.
41%
of corporate loyalty leaders cannot quantify their program's overall financial impact
(EY 2024 Loyalty Market Study)
The global loyalty management market was valued at $10.67 billion in 2023, growing at 9.2% annually through 2030, according to Markets and Markets. That market scale reflects what companies are actually spending. Budget your program costs against that context before you model ROI.
How to Translate Loyalty Metrics into CFO-Ready Language
A CMO and a CFO are looking at the same program and seeing different things.
The CMO sees engagement rates, member growth, and NPS movement. The CFO sees costs, liabilities, and a number that is hard to reconcile with the income statement. Bridging those two views is the work most loyalty presentations skip.
Three things make a loyalty ROI presentation finance-ready:
First, use a control group or a pre/post analysis. A side-by-side comparison of matched member and non-member cohorts over the same period removes selection bias. If a true control group is not feasible retroactively, measure average spend per member in the 90 days before enrollment against the 90 days after. The difference is your incrementality estimate.
Second, show the compounding math. A 5% improvement in customer retention can lift profits between 25% and 95%, according to Bain and Company and Harvard Business Review. That range reflects margin variation across industries. Even the floor of that range outperforms most paid acquisition campaigns. Present retention improvement as a profit lever, not just a program metric.
Third, model a range of scenarios. Finance teams distrust single-point ROI projections. Build a conservative case, a base case, and an upside case. The range signals that you have stress-tested your assumptions. Brands with high-quality first-party loyalty data also see 15–20% improvements in paid media conversion rates, according to Brandmovers. Include that downstream efficiency gain in your business case.
The Indirect Benefits Your ROI Formula Will Not Capture
Some value is invisible to the formula.
Gartner's research shows that 80% of a company's future revenue comes from 20% of its existing customers. Loyalty programs concentrate investment on that group by design. Some of the returns come back as reduced churn, lower acquisition costs, and referral behavior rather than a direct line item in the ROI model.
Four indirect benefits belong in any honest program evaluation:
- First-party data asset: a loyalty program builds a behavioral, preference, and purchase data set at scale that your paid media team can use for targeting. Brands with mature loyalty data see meaningful improvements in paid acquisition efficiency.
- CAC reduction through referrals: loyalty programs reduce customer acquisition costs by an average of 25% through referral behavior, per industry research. Referred customers also show 67% lower churn than customers from paid channels.
- NPS and brand advocacy: members who feel recognized are significantly more likely to recommend your brand. NPS movement is hard to monetize directly, but churn reduction is not. Each percentage point of churn reduction protects measurable revenue.
- Customer insight quality: tracking member behavior across transactions, channels, and time makes every other marketing function smarter. That value compounds year over year.
These benefits do not replace the incremental revenue calculation. They supplement it. When a finance team pushes back on your ROI number, indirect benefits give you a floor: even in the conservative scenario, the program generates value the formula does not capture.
Common Loyalty ROI Mistakes and How to Fix Them
The errors that kill loyalty program business cases are consistent across industries.
Measuring total member revenue instead of incremental
A member who was spending $400 a month before enrollment and spends $420 after enrollment contributed $20 in incremental revenue, not $420. If your ROI presentation uses total member spend as the numerator, the number is inflated and will not survive a finance review.
Measuring too early
Year one of a loyalty program is dominated by enrollment costs, platform setup, and reward issuance before redemption behavior matures. Measuring ROI at six months almost always produces a negative or flat number that reflects program startup costs, not steady-state performance. Wait at least 12–18 months before drawing conclusions about program viability.
Underestimating redemption liability
Points issued are a cost you have not paid yet. Programs that issue aggressively and provision conservatively carry more liability than their ROI model shows. Track actual redemption rates against your provisioning assumptions and update them quarterly.
Not having a CLV model
According to the DDMA Data-Driven Marketing Report, 42% of companies have not implemented a formal CLV model, missing an average of 23% in potential retention revenue. Without CLV tracking by cohort, you cannot tell whether the program is building better customers or simply rewarding the ones you already had.
How Xoxoday Loyalife Helps You Measure Loyalty ROI With Confidence
The reason 41% of loyalty leaders cannot quantify program impact is not that the math is too hard. It is that most platforms track engagement without connecting it to financial outcomes. Redemption rates are logged, but they are not tied to CLV uplift, purchase frequency change, or incremental revenue by segment.
Xoxoday Loyalife is built to close that gap. The analytics layer tracks member behavior across the full program lifecycle, from enrollment through redemption, and surfaces CLV comparison between members and matched non-members. Loyalty managers can segment by tier, channel, and product category to see exactly where incremental value is being generated and where it is leaking.
For enterprise programs running across banking, retail, and FMCG channels, Loyalife connects program performance to CRM and CDP data, making pre/post and control group analyses possible without custom data engineering. The reporting layer exports loyalty metrics directly into formats that work for finance reviews and board-level business cases.
Programs with advanced analytics see 5–10% revenue growth and 10–20% improvement in marketing efficiency, according to McKinsey. That return comes from knowing not just that your program is working, but precisely which customer segments it is working for.
12–18%
More incremental revenue per year
Loyalty members vs. non-members across industries (Accenture)
5–10%
Revenue growth from advanced analytics
Programs using advanced loyalty analytics vs. standard dashboards (McKinsey)
25–95%
Profit lift from 5% retention improvement
The compounding return that retention-focused programs produce (Bain & Company / HBR)
15–20%
Paid media efficiency gain from loyalty data
Brands with mature first-party loyalty data vs. those without (Brandmovers, 2026)
Loyalife covers the full loyalty value chain, from program configuration and member management through engagement, rewards, redemption, and reporting, across 150+ countries and 10M+ reward options. For CMOs who need to prove ROI at global scale, that coverage removes the regional data gap that undermines so many business cases before they reach the boardroom.