Key Takeaways
A 5% increase in retention can boost profits by up to 95%, yet most brands still treat loyalty programs as a tactic, not a foundation
Customers who redeem loyalty rewards churn at significantly lower rates. Tracking redemption vs churn rate is the ROI metric your CFO needs
Behavioral warning signs appear weeks before a customer cancels, and every one of them is visible inside a well-configured loyalty platform
Your retention strategy is probably a list of tactics. Loyalty is not a tactic.
Most guides to reducing customer churn prescribe the same things: improve onboarding, respond faster to complaints, run exit surveys, add proactive check-ins. All worth doing. But they are interventions applied after trust has already eroded. Building a retention strategy from tactics alone is like fitting airbags to a car with no seatbelts.
Customer acquisition costs have risen 222% over the past eight years. Every customer you lose costs more to replace than it ever has. This post gives Heads of Retention a clear-eyed view of why customers leave, how to spot the signals before they do, and why loyalty programs are the structural foundation that most retention frameworks are missing.
What is customer churn?
Customer churn, also called customer attrition, is the percentage of customers who stop doing business with a company during a defined time period. It is the most direct measure of whether a product, service, or relationship is delivering enough value to keep customers.
Churn Rate = (Customers lost during period ÷ Customers at start of period) × 100
A 5% monthly churn rate sounds manageable. Compounded over twelve months, it erodes nearly half your customer base.
5–25×
Cost to acquire vs retain a customer
The gap that makes churn the most expensive problem in growth – Harvard Business Review
5%
Retention increase = 25–95% profit uplift
The asymmetric return that makes retention the highest-ROI lever – Bain & Company
222%
Rise in customer acquisition costs over 8 years
Why the cost of losing a customer keeps rising – LoyaltyPass, 2025
75%
Average retention rate across all industries
The baseline every retention leader should benchmark against – ElectroIQ, 2025
Why customers really churn: root causes retention leaders misread
Most post-mortems settle on "they found a cheaper option" or "poor product fit." Both are symptoms. The actual chain runs deeper, and it usually starts months before the cancellation.
Four patterns account for the majority of churn across industries:
- Value erosion: the product delivers less than the customer expected at purchase. Most pronounced in commoditized categories – banking, telecoms, insurance – where switching costs are low and alternatives are easy to find.
- Silent disengagement: customers stop engaging before they formally cancel. Logins fall, usage drops, support tickets quiet down. Not because things are going well, but because the decision to leave has already been made.
- Onboarding failure: customers who do not reach a first-value milestone within 30 to 90 days are disproportionately likely to churn. Most businesses do not track this milestone at all.
- No loyalty signal: when a customer has no earned benefits, no tier status, and no personalized relationship with a brand, switching costs are essentially zero. A well-designed loyalty program changes that calculation permanently.
Customers do not leave because they hate you. They leave because staying does not feel worth it.
How to measure customer churn rate: metrics that actually signal risk
Churn rate is the starting point, not the whole picture. On its own, it tells you customers left. It does not tell you who was at risk, when the signal appeared, or which segments are holding.
59%
of loyalty professionals cite CLV as their top business goal
CLV is the metric that connects retention effort to revenue – not just a hygiene measure – G2, 2025
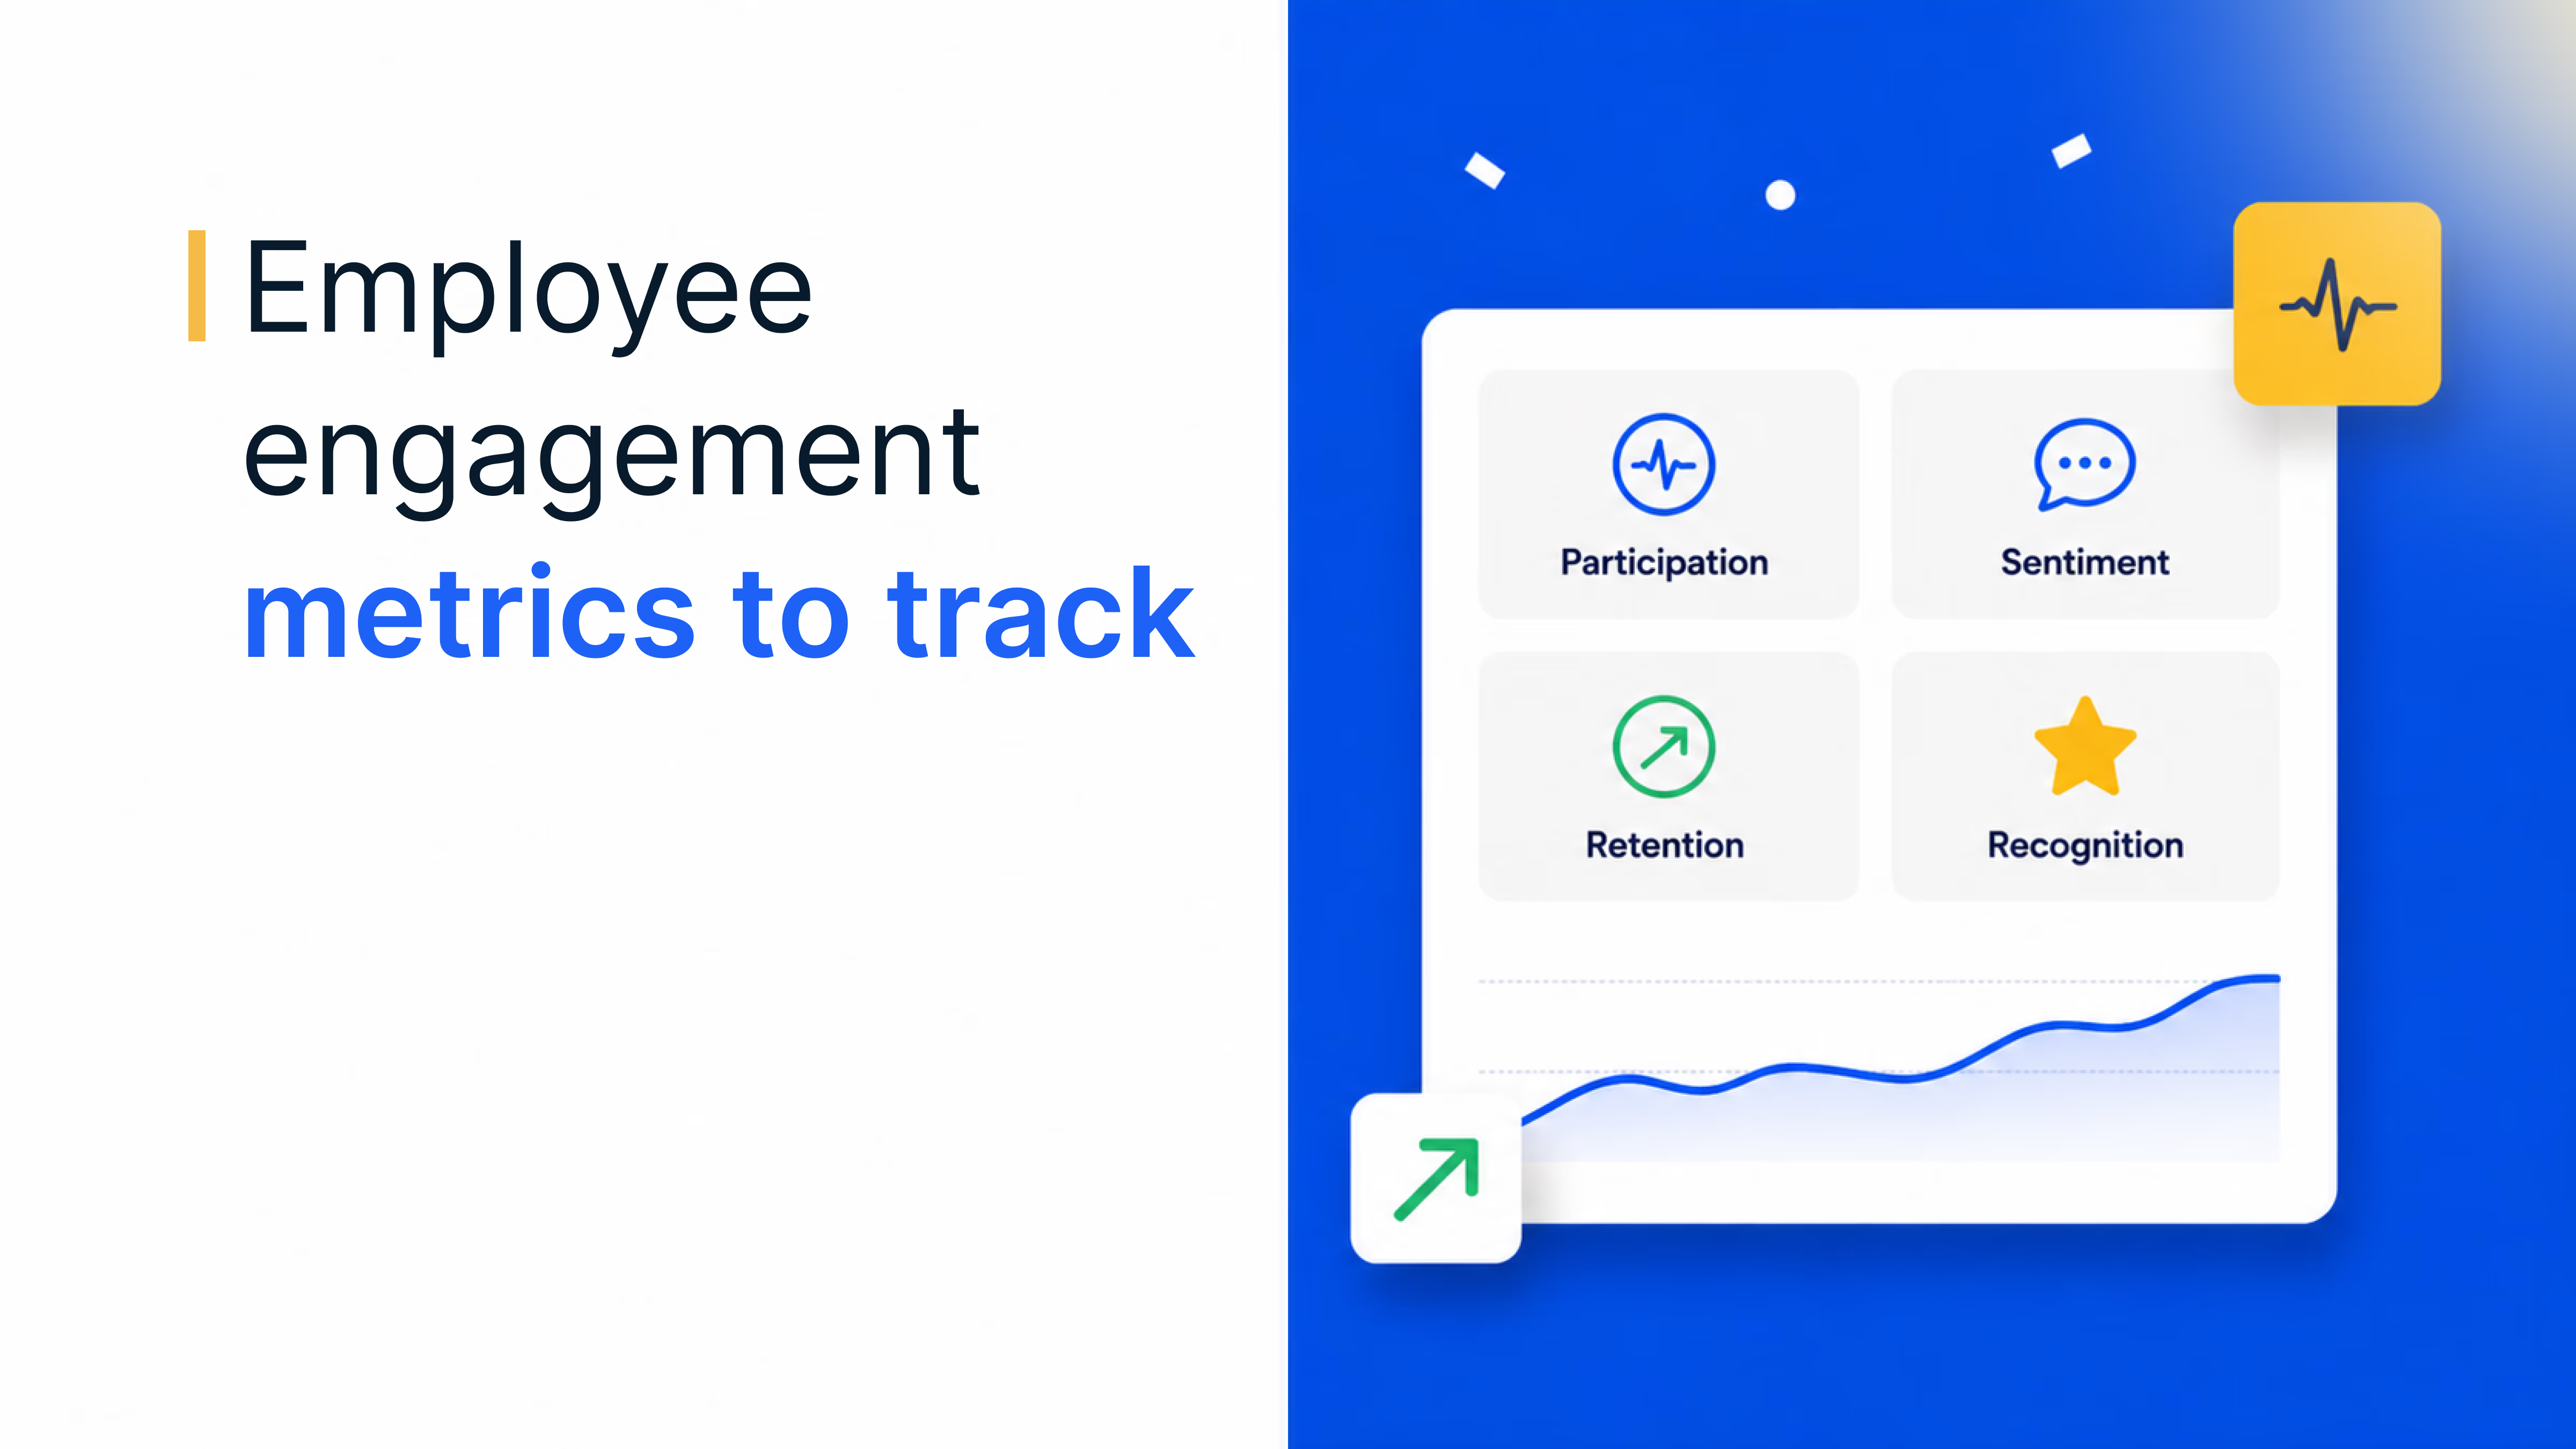
Four metrics tracked together give a complete view:
- Customer churn rate: The baseline, tracked monthly or quarterly by segment. Never as a single blended number – segment-level churn is where the patterns live.
- Net Promoter Score (NPS): A leading indicator. NPS decline typically precedes measurable churn by one to two quarters, giving retention teams a window to act.
- Customer Lifetime Value (CLV): Understanding CLV by segment reveals which churn is financially critical and which is acceptable. This is the metric that turns a retention conversation into a revenue conversation.
- Loyalty health scores: Composite scores tracking redemption activity, tier progression, engagement frequency, and support ticket volume. A customer whose points are accumulating without redemption is not engaged. They are waiting.
The goal is not to measure churn after it happens. It is to measure the signals that predict it three to six months out, while there is still time to act. For a full breakdown of retention KPIs, explore our guide to B2B customer retention metrics.
See how Loyalife surfaces loyalty health scores to spot churn risk early
Connect engagement data, redemption signals, and tier progression in one retention view.
See Loyalife in actionTrusted by 5,000+ companies
Four early warning signals a customer is about to leave
Churn is almost always visible before it becomes a cancellation. McKinsey research found that analytics-driven retention programs can reduce churn by up to 15% in mature programs. The difference is not better data – it is the discipline of acting on behavioral signals weeks before a customer decides to leave.
15%
Churn reduction in analytics-driven retention programs
Mature programs that act on behavioral data systematically outperform reactive approaches – McKinsey
Watch for these four signals:
- Usage decline: Logins drop, session frequency falls, feature adoption plateaus. In loyalty programs, this appears as points accumulating without any redemption activity. A rewards balance that never moves is a warning sign, not a sign of wealth.
- Support ticket spikes: A sudden increase in volume around the same issue signals a frustrated customer who has not yet made the decision to leave but is close to it.
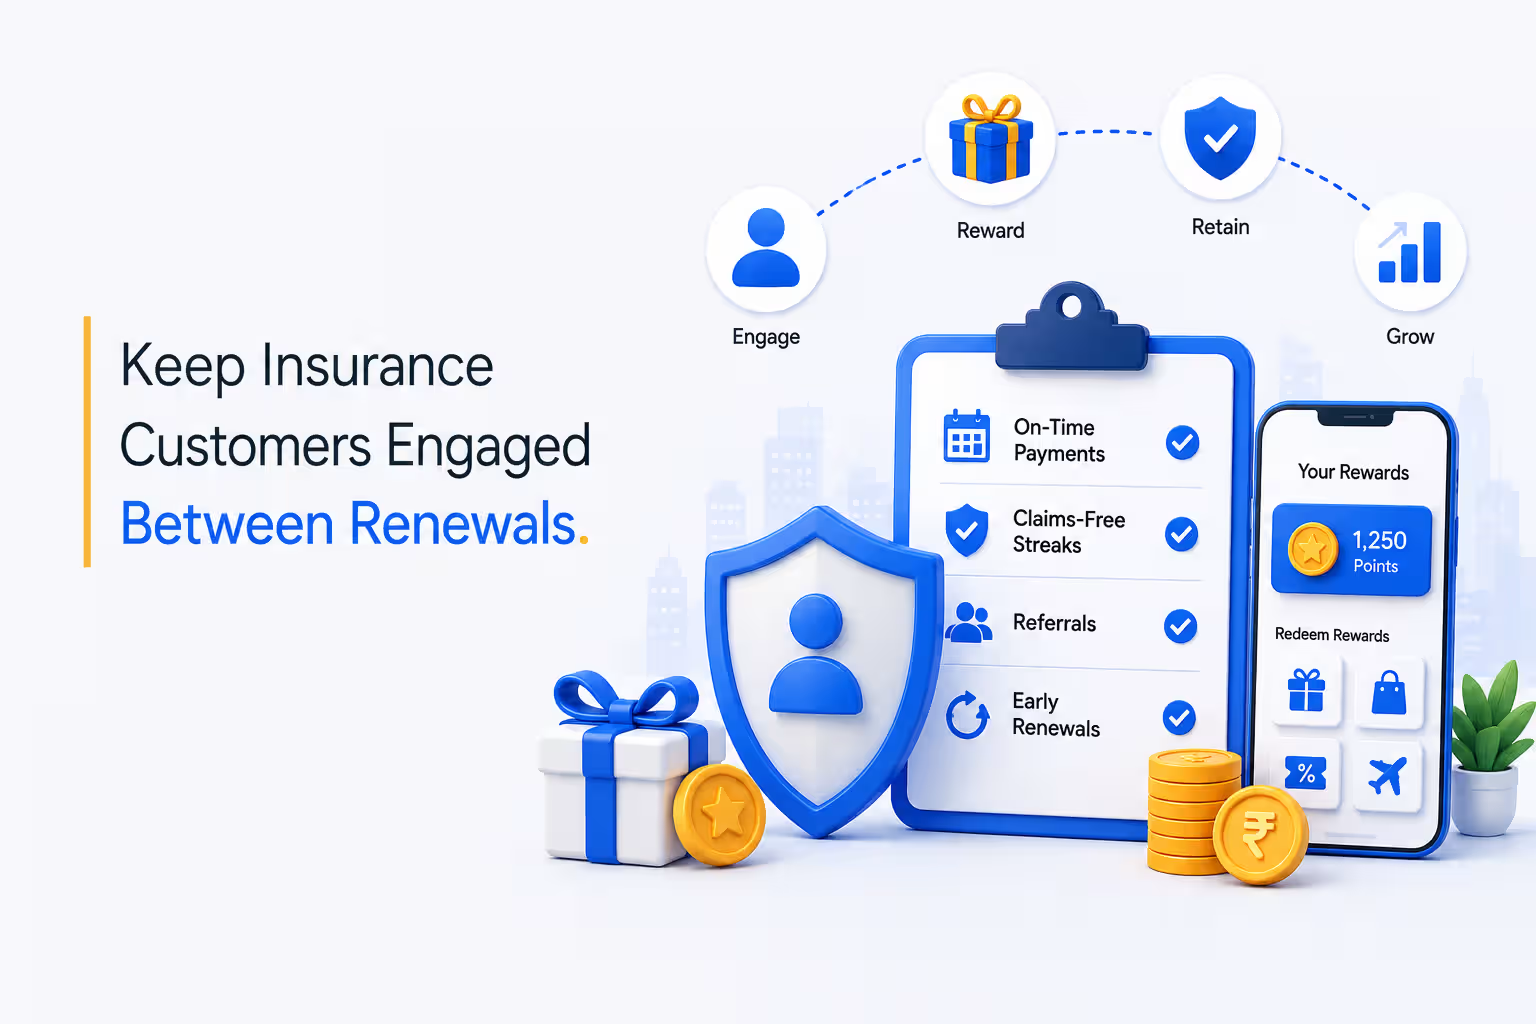
- Missed program milestones: Customers who do not reach their first redemption, first referral, or first tier upgrade within expected timeframes are at measurably higher churn risk than those who do.
- Stakeholder change: The primary contact changes role or leaves the organization. In enterprise BFSI accounts, this is one of the highest-risk churn triggers and one of the least systematically tracked.
Responding to any one of these signals takes 48 hours. Ignoring all four is how you lose a customer you could have kept. See our guide to B2B customer retention strategies for a playbook on acting on these signals at scale.
Why generic retention tactics fail and what loyalty programs do differently
Most retention guides treat loyalty programs as item seven on a list of thirteen strategies. That framing understates what loyalty programs actually do.
A well-designed loyalty program is not a discount mechanism. It is structural infrastructure that changes the economics of leaving. When a customer has accumulated tier status, reward points, and personalized benefits, switching to a competitor means forfeiting real earned value. That friction is not emotional – it is financial.
Emotional loyalty – where customers stay out of genuine preference rather than incentive – has risen 26% since 2021 and now accounts for 34% of all loyal customer relationships, according to the Bond Brand Loyalty Report. Generic tactics patch churn. A loyalty program prevents it.
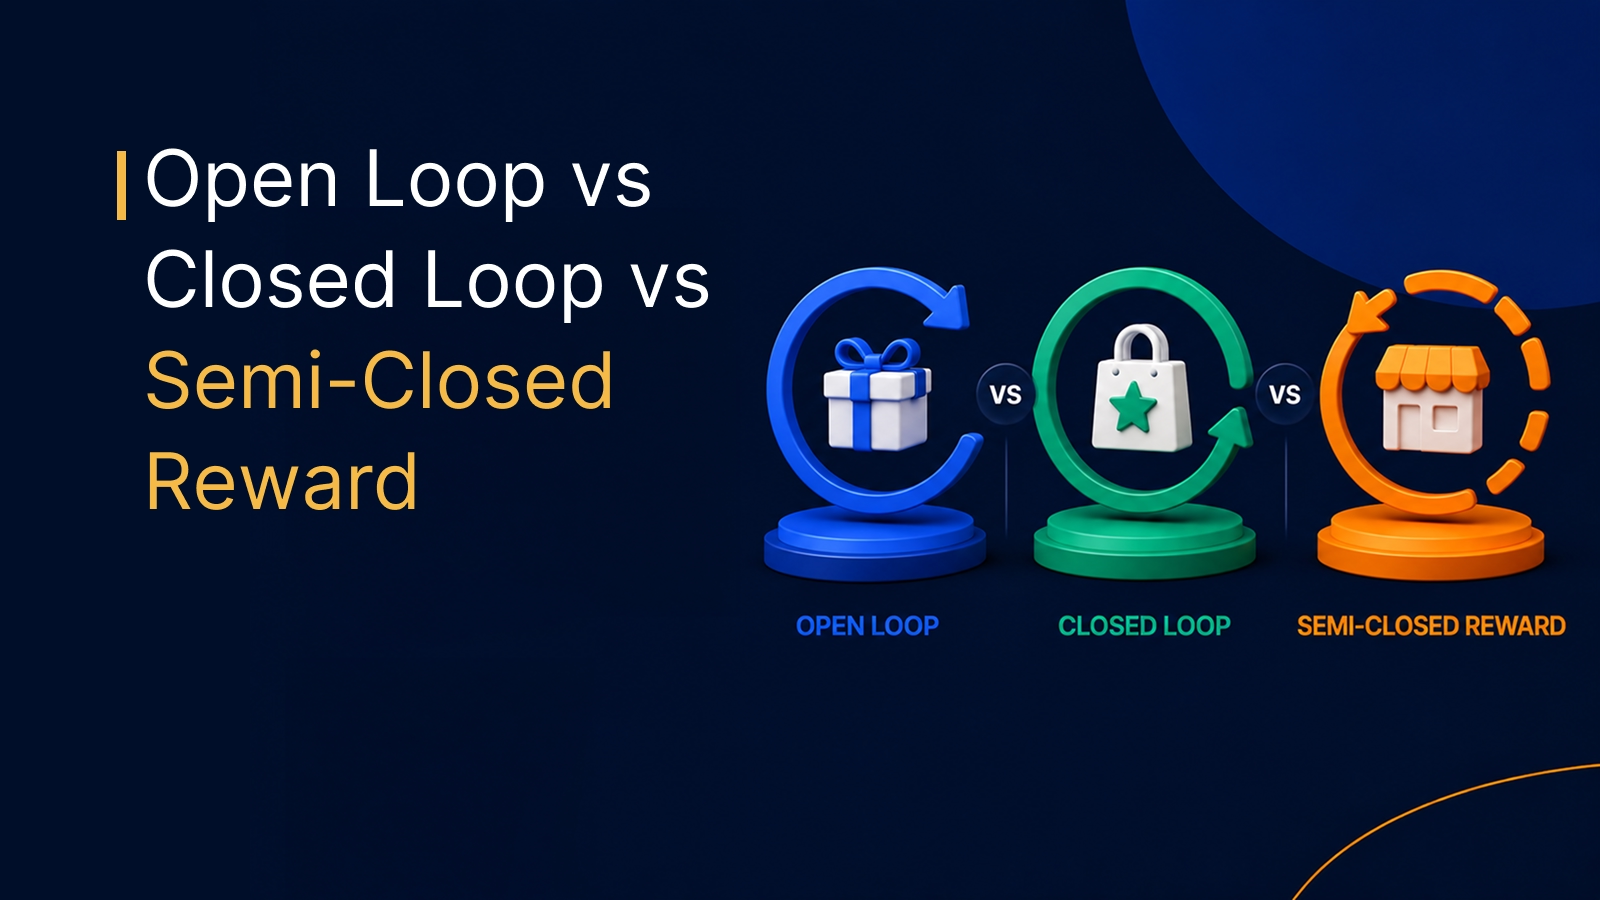
Five loyalty mechanics that reduce churn most effectively
Not all loyalty program structures produce the same retention outcome. The right structure depends on industry, transaction frequency, and how the customer relationship is built.
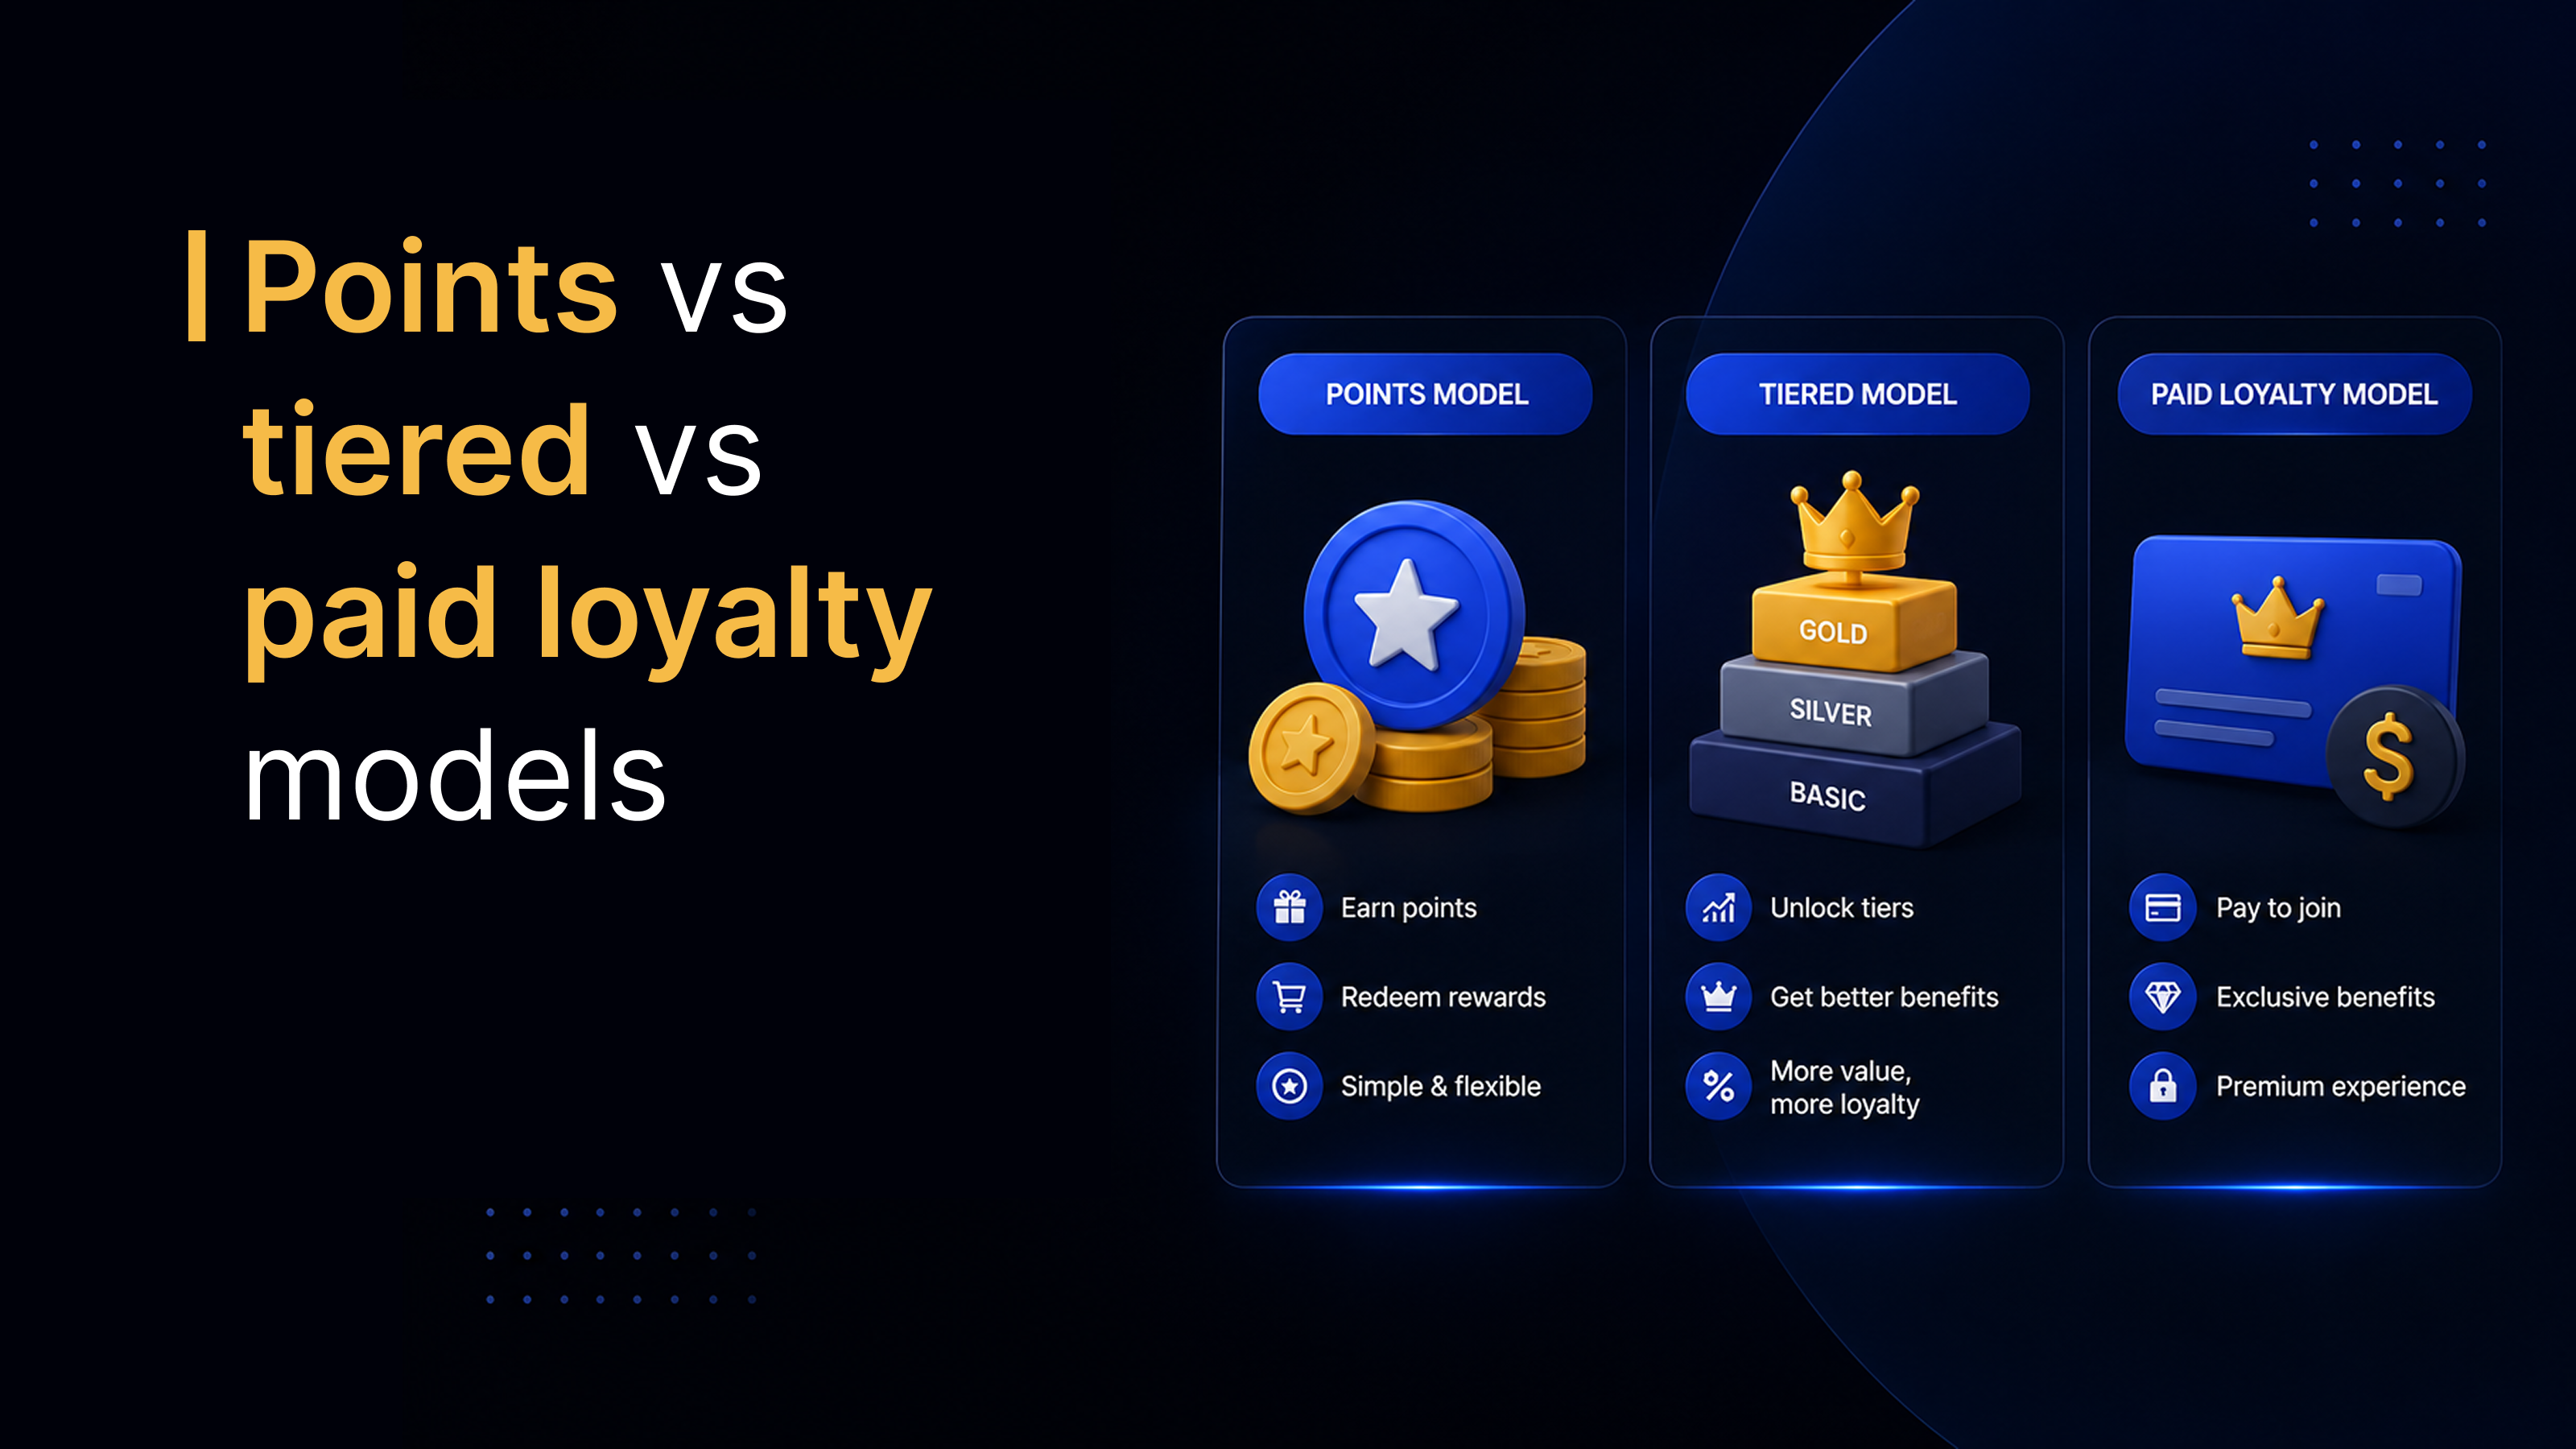
| Program type | Best for | Churn impact | Key driver | Complexity |
|---|---|---|---|---|
| Points-based | Retail, FMCG, card banking | High | Purchase frequency | Low |
| Tiered membership | BFSI, telecoms, airlines | Very high | Status progression | Medium |
| Coalition loyalty | Multi-brand, banking, malls | High | Cross-brand value | High |
| Gamified programs | D2C, digital banking, apps | Medium–high | Engagement milestones | Medium |
| Subscription loyalty | SaaS, grocery, D2C | High | Upfront commitment | Medium |
For BFSI customers in the GCC, where banking products are commoditized and customers often maintain five or more financial relationships at once, tiered programs linked to card spend and multi-product engagement are the most effective at raising switching costs.
In Indonesia and the Philippines, WhatsApp-native gamified loyalty programs have become a high-retention mechanic. Near-total messaging app penetration means programs stay active without requiring a separate app download. Explore the full range of customer loyalty program structures and how to choose the right one for your industry.
How to measure loyalty program ROI against churn reduction
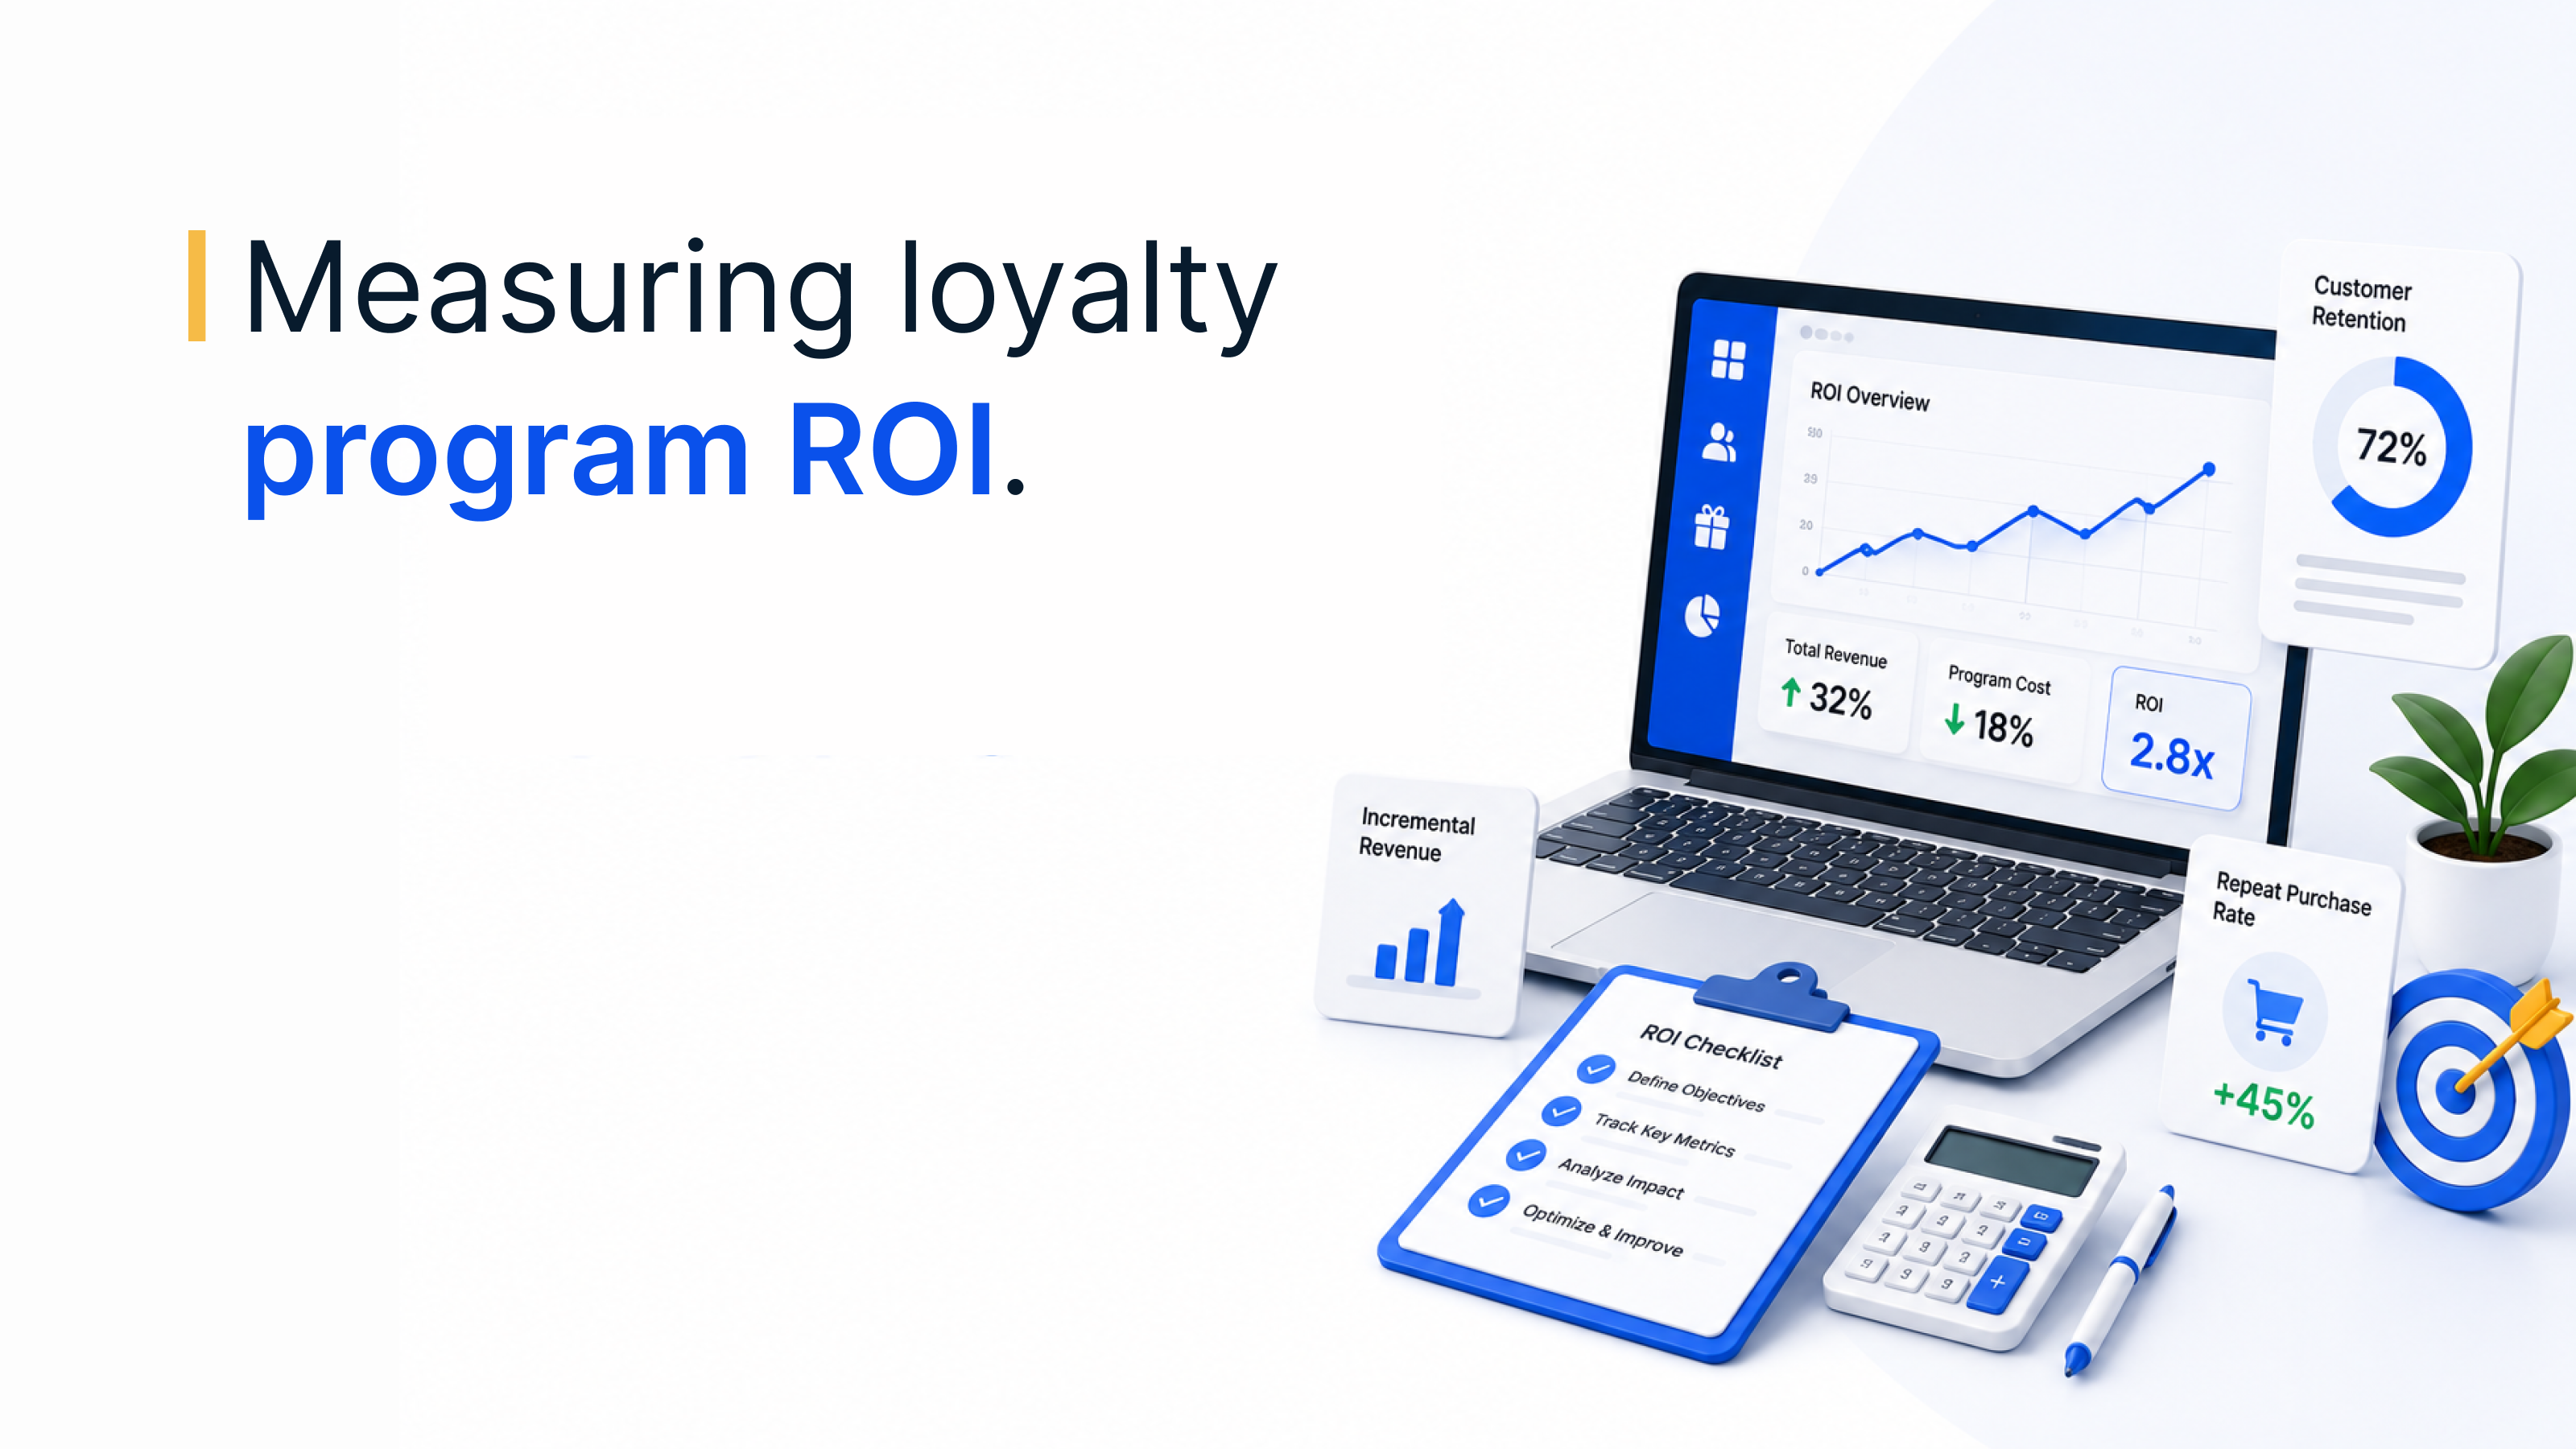
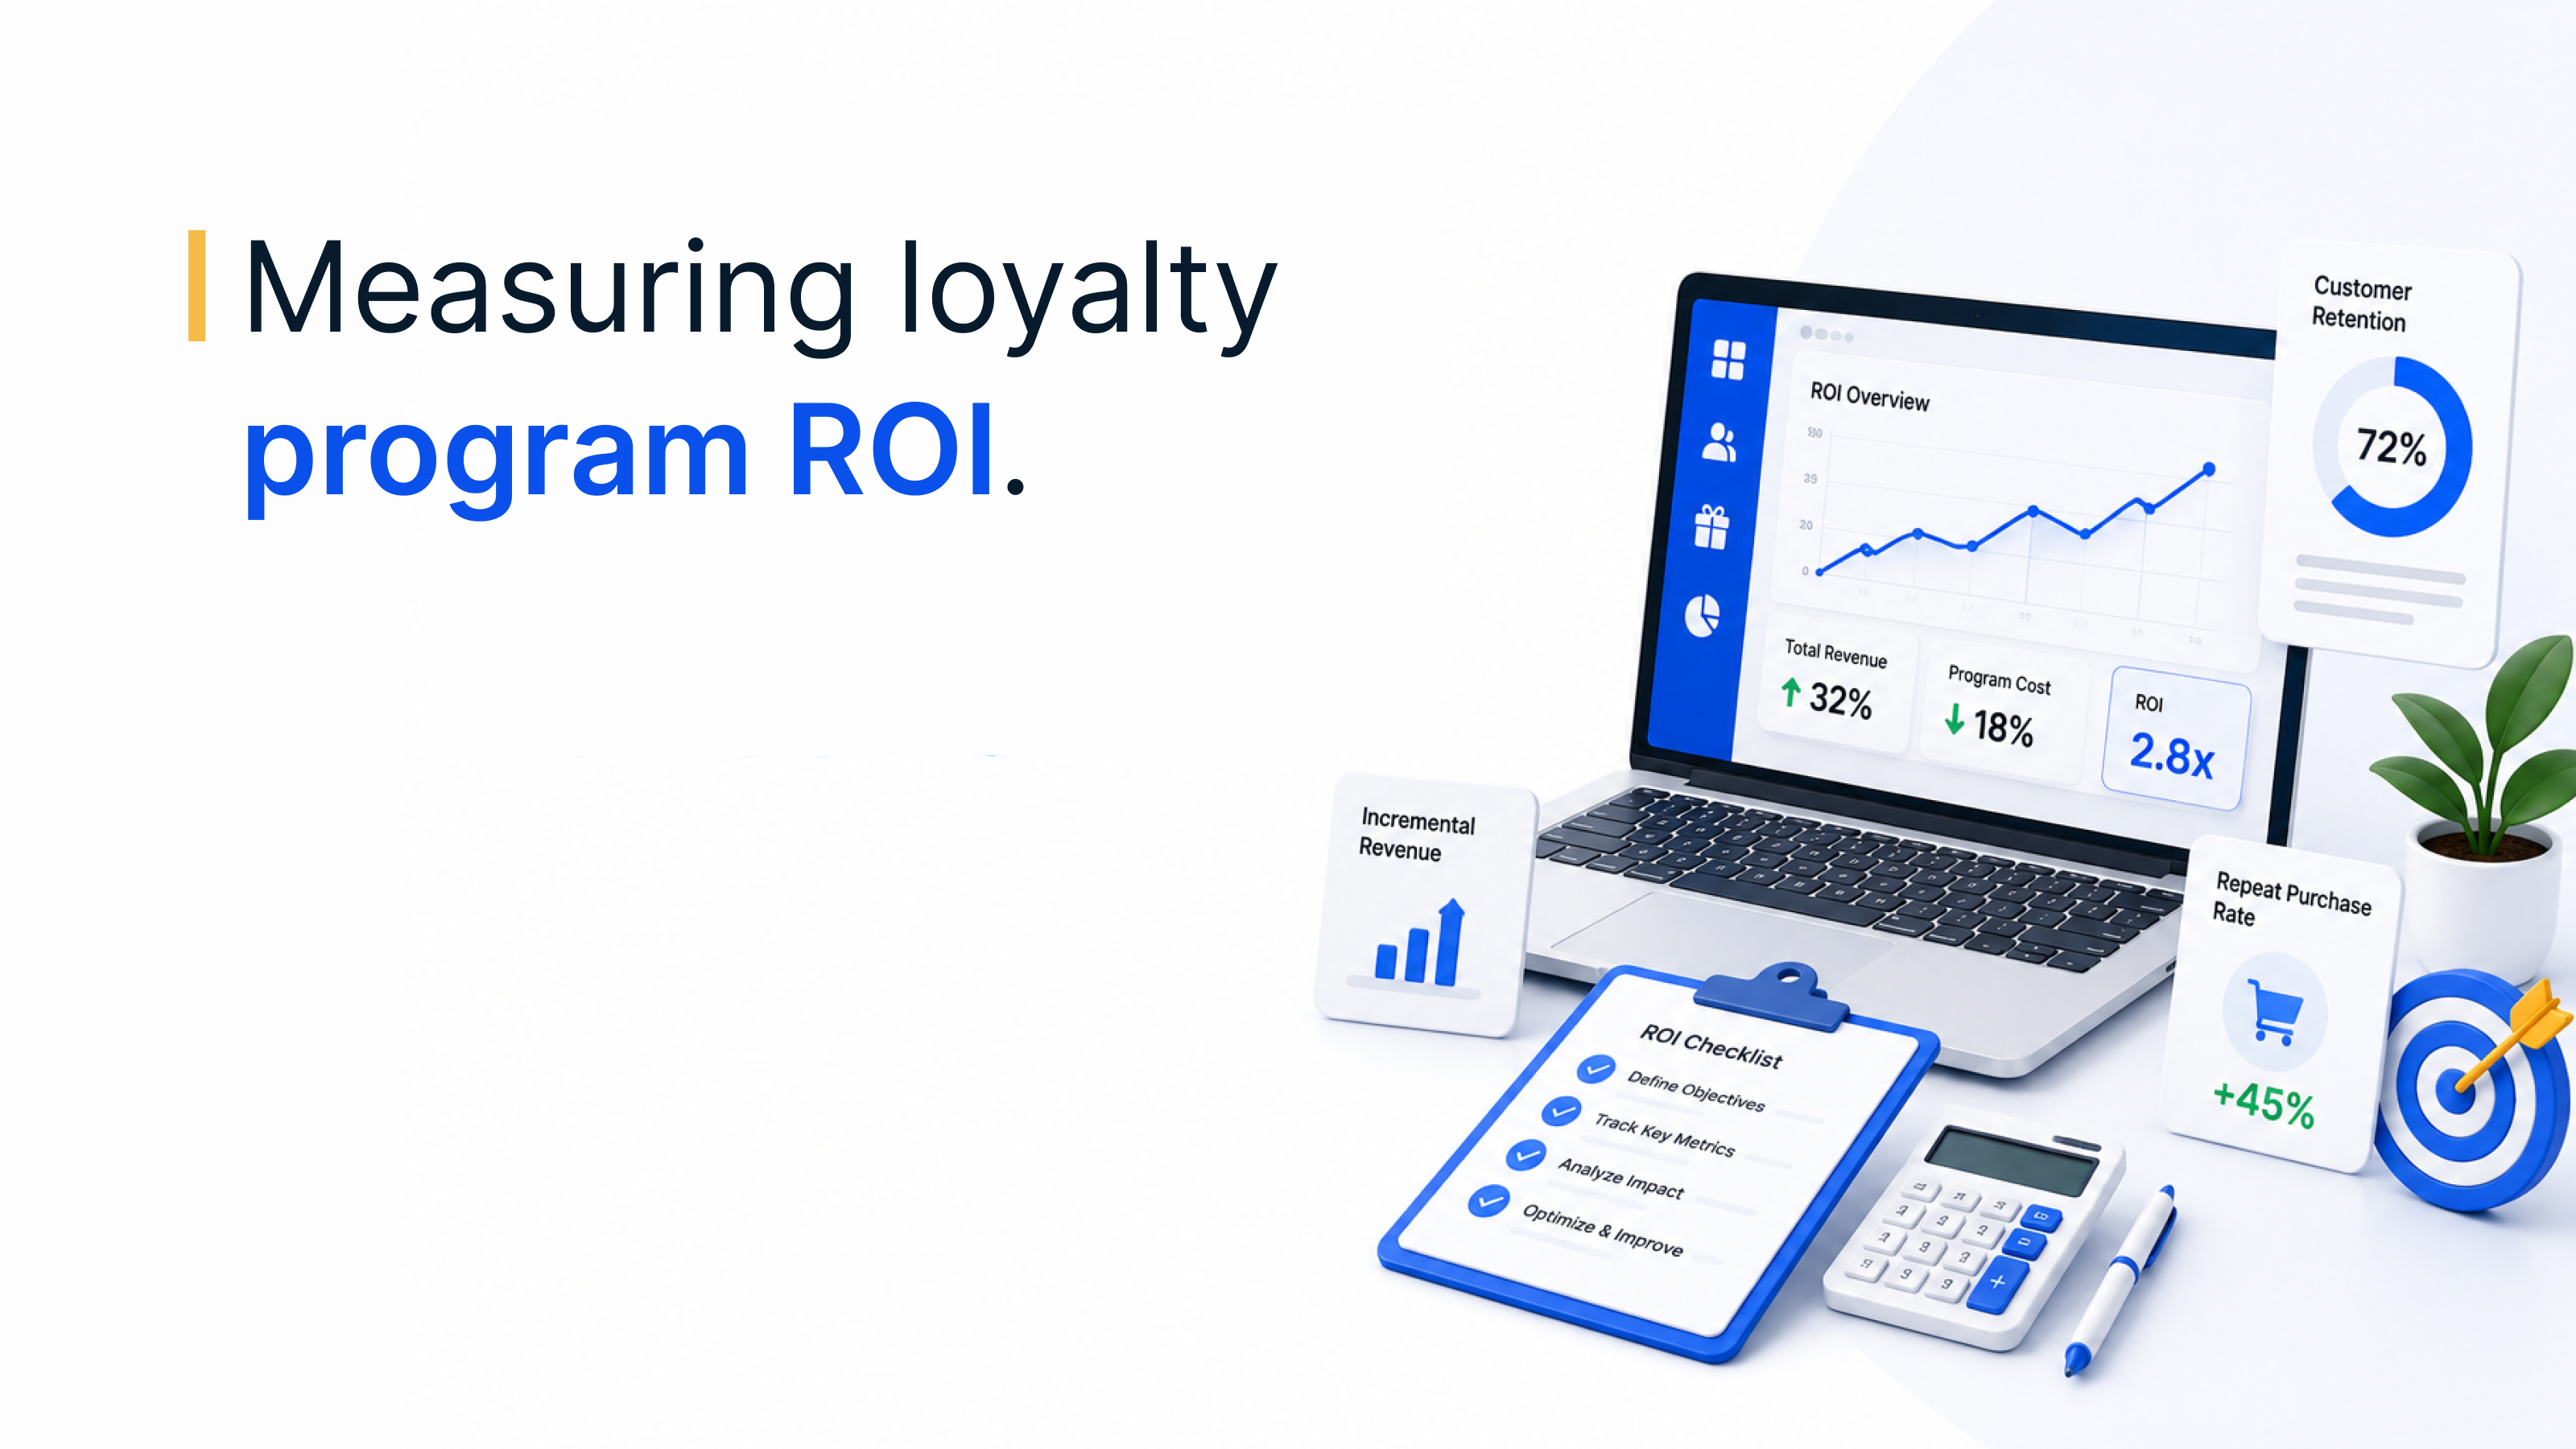
Retention leaders face pressure to justify loyalty program investment in terms that finance teams understand. The bridge requires four connected data points.
- Redemption rate vs churn rate: Customers who actively redeem rewards churn at significantly lower rates than those who accumulate without redeeming. The gap between redeemers and non-redeemers is the most direct proof of program value.
- CLV delta: Compare the lifetime value of loyalty program members versus non-members across the same customer tenure. This is the metric that turns a retention conversation into a revenue conversation.
- Repeat purchase rate: For retail and D2C brands, the repeat purchase rate among program members versus the general customer base shows direct revenue impact, independent of discount spend.
- NPS by tier: NPS tends to be measurably higher among loyalty program members at upper tiers – evidence the program is driving genuine preference, not purely incentivized behavior.
For enterprise programs in regulated industries, account product depth – the number of products a single customer holds – is an additional indicator. Programs that reward multi-product engagement consistently reduce run-off rates because customers with three products have more to lose by leaving than customers with one.
Regional churn patterns in BFSI, retail, and telecoms
Churn drivers and the loyalty mechanics that address them vary significantly by market. A retention leader deploying a global program without regional calibration will see uneven outcomes.
| Region | Points program | Tiered / multi-product | Gamification | WhatsApp-native |
|---|---|---|---|---|
| GCC (BFSI) | Medium | High | Low | Low |
| Africa (BFSI) | High | Medium | Low | High |
| Philippines | Medium | High | Medium | High |
| Indonesia | Medium | Medium | High | High |
| KSA (BFSI) | Low | High | Low | Low |
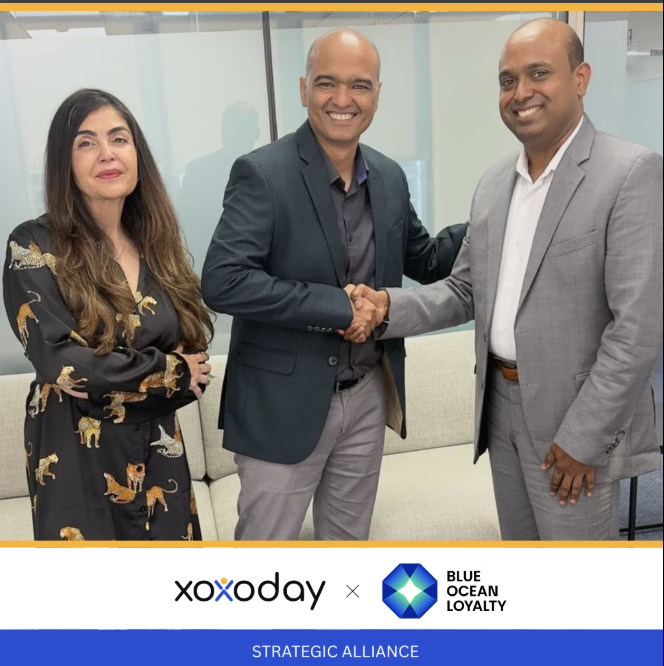
In the GCC, mid-size banks are the primary loyalty program growth market. The opportunity is not with tier-1 institutions running legacy stacks – it is with mid-to-small banks competing for share among customers holding multiple financial relationships. Partnerships with network-level and core banking providers accelerate deployment and add credibility for enterprise BFSI buyers.
In Africa, category education is still the primary challenge. Most BFSI and telecoms brands operate basic points programs without gamification or real-time redemption. The gap between what enterprise loyalty technology can deliver and what the market currently deploys is a genuine competitive advantage for brands willing to move first.
In Indonesia and the Philippines, WhatsApp-native loyalty journeys are the default engagement channel for mass retail banking and FMCG customers, driven by near-universal messaging app penetration. For a deep dive into how loyalty programs are reshaping retention in banking, see our guide to customer loyalty in the banking industry.
How Xoxoday Loyalife helps retention leaders reduce churn at scale
Turning the strategies above into a running program requires more than a loyalty module attached to a CRM. It requires an end-to-end platform built for enterprise complexity.
01 · Program config
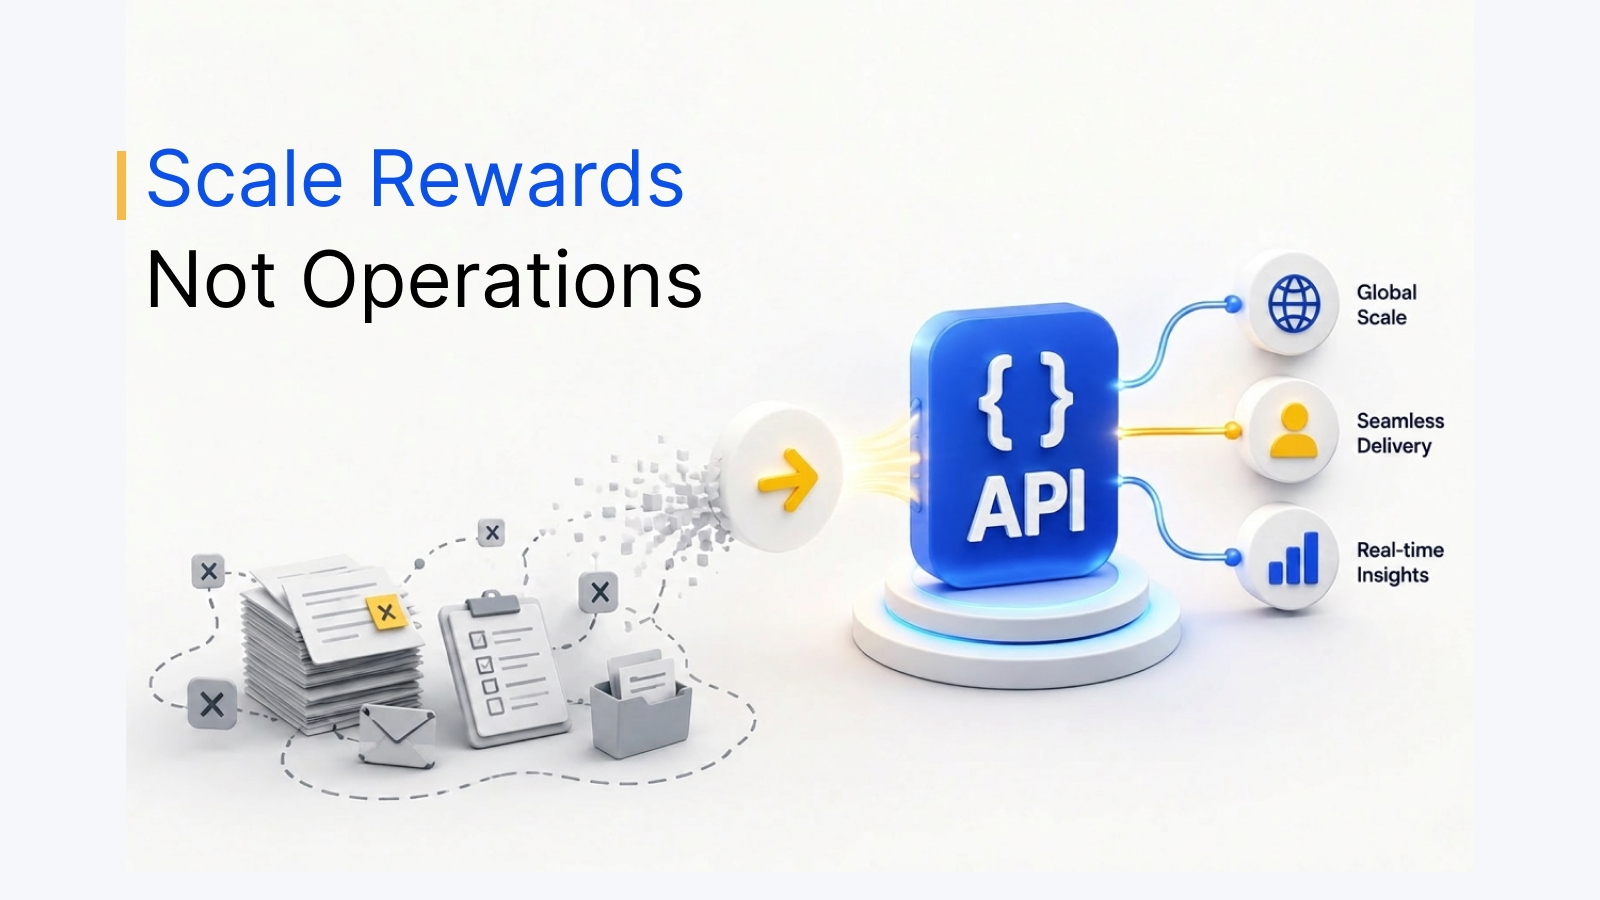
Any program type, no dev dependency
Points, tiered, coalition, gamified, and subscription loyalty – all configurable by the loyalty team without raising an IT ticket.
02 · 10M+ rewards
Global rewards marketplace
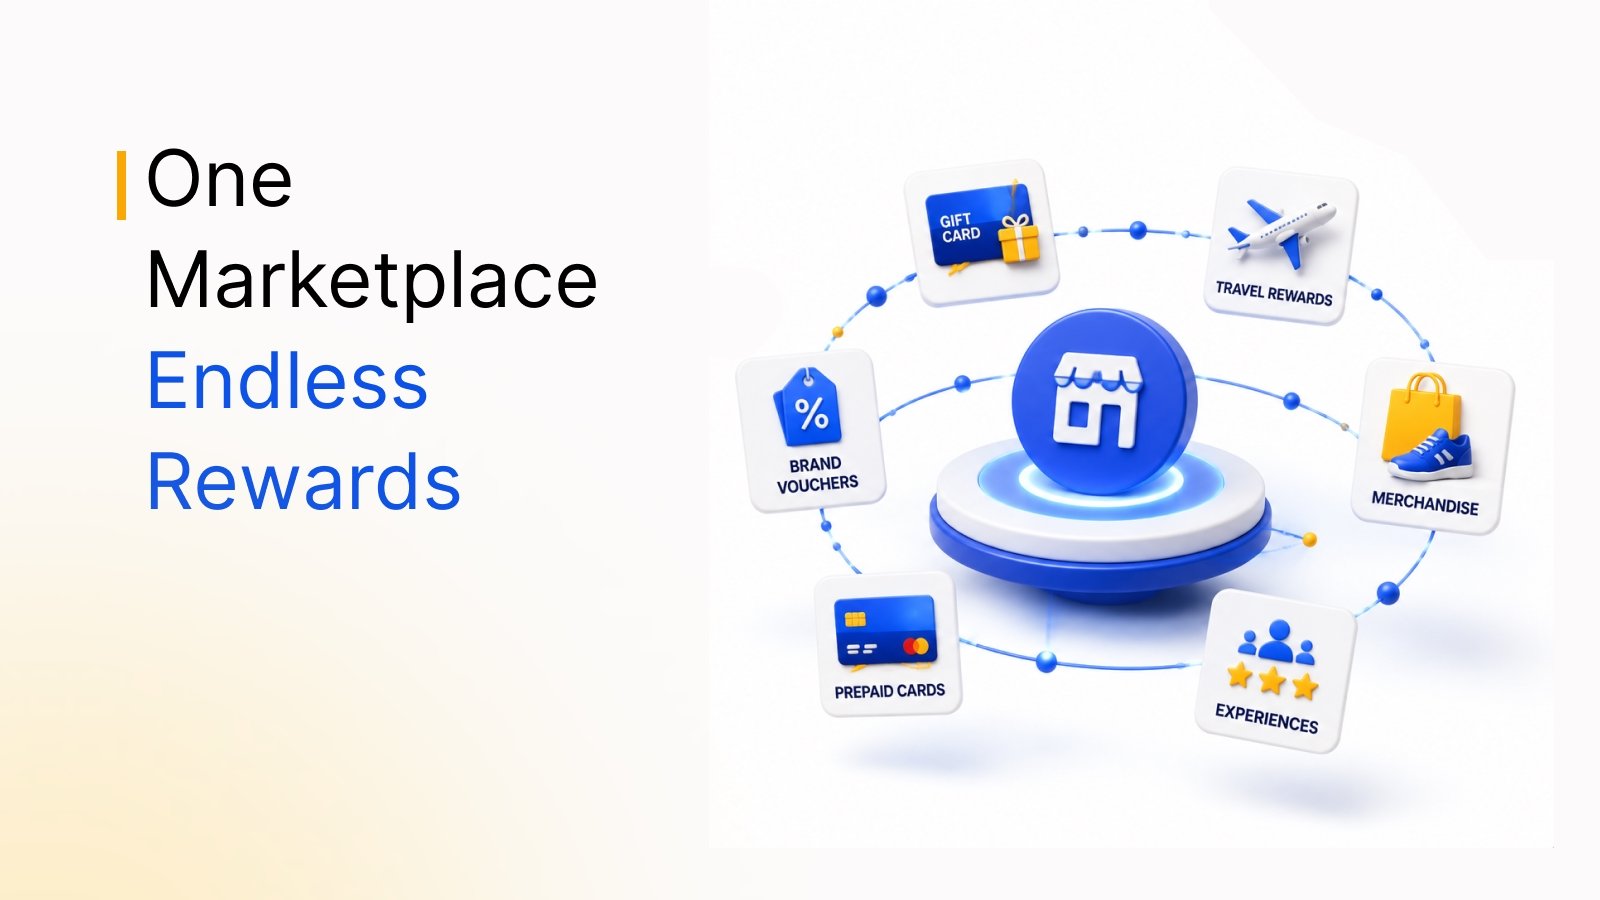
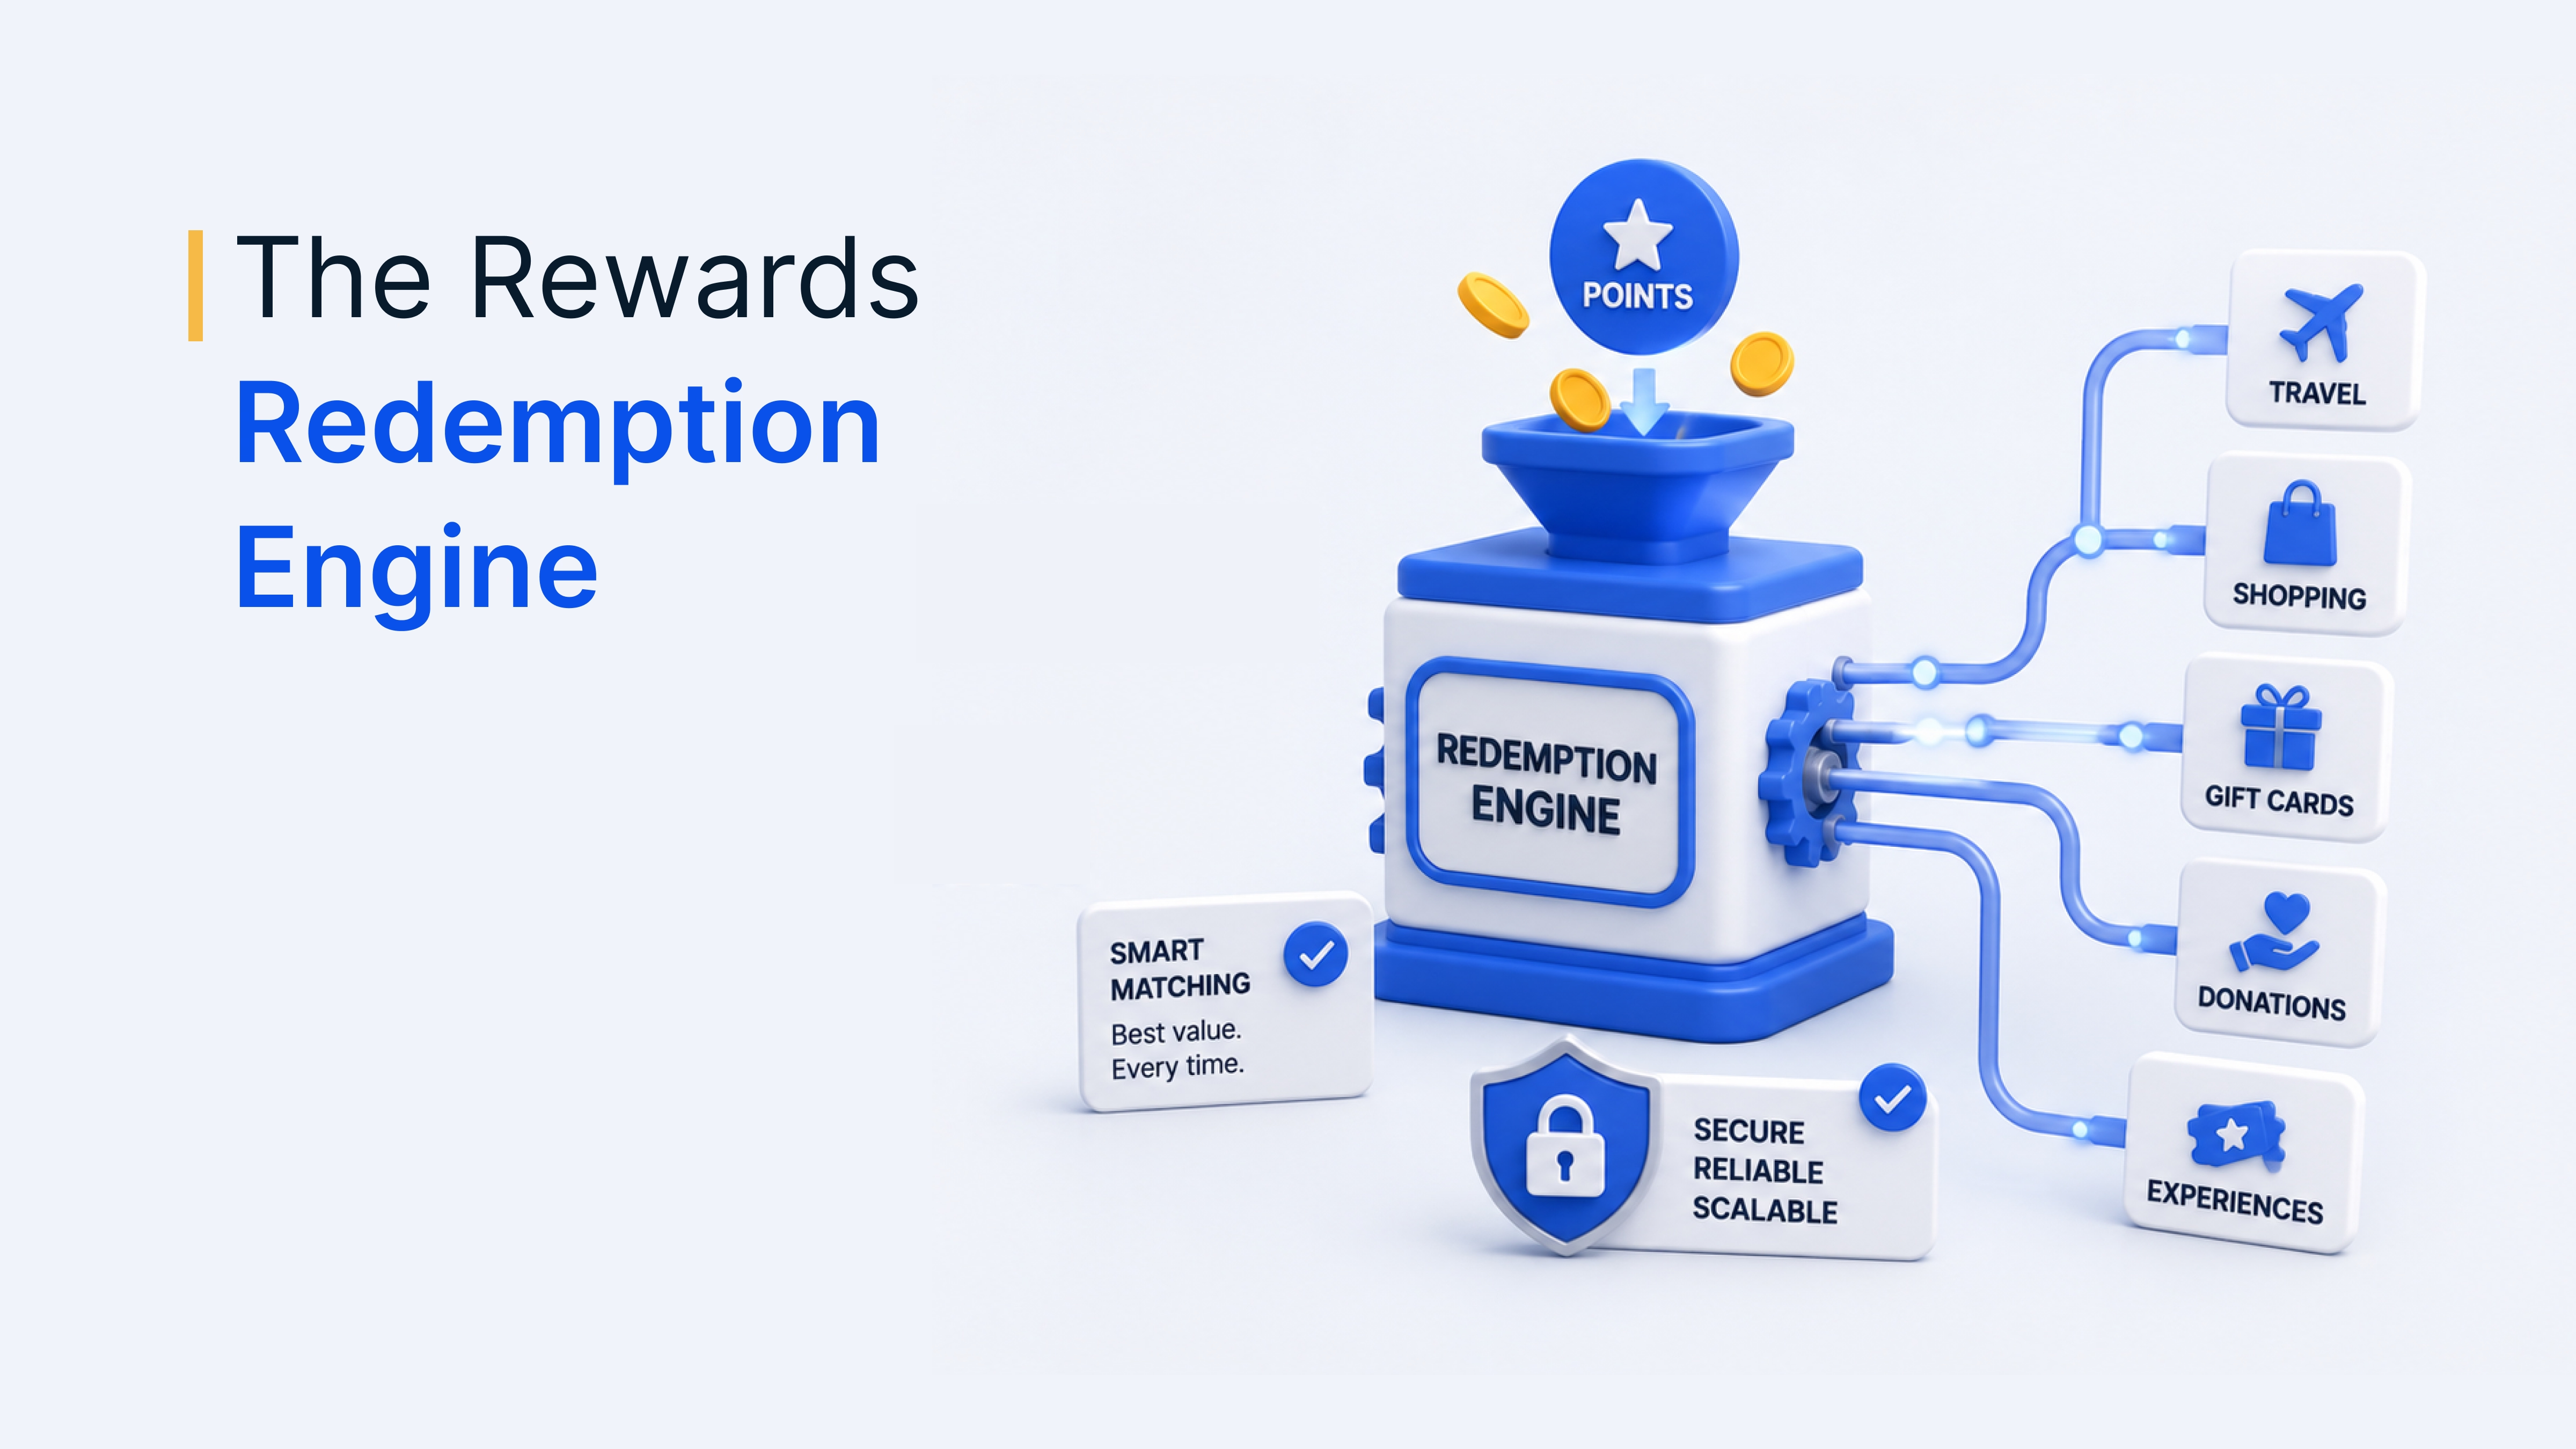
10M+ reward options across 150+ countries – gift cards, experiences, merchandise, and digital vouchers across every major region.
03 · BFSI-ready
Enterprise security and compliance
SOC 2 certified, GDPR compliant, on-premise and private cloud deployment, maker-checker workflows, and full audit trails – built for regulated industries.
04 · WhatsApp loyalty
Messaging-native engagement
Loyalty journeys delivered directly inside WhatsApp – no app download required, no additional channel to manage, near-100% reach in SEA and Africa.
5,000+
enterprises
150+
countries
10M+
rewards options
$5B+
rewards distributed
Your next step toward a lower churn rate
Reducing customer churn is not a single-quarter initiative. The brands that consistently retain customers build loyalty as structural infrastructure – not a reactive campaign launched when numbers go soft.
The warning signals are available. The program mechanics are proven. Start with the loyalty program design. The retention results follow.