Key Takeaways
Most maps fail because they are drawn from the inside. If the stages match your internal handoffs, you have mapped an org chart.
One persona and one goal per map. Combining personas produces an average customer who does not exist.
Walk the journey yourself, on a phone, without an internal account. It finds more friction than any workshop.
If a smiley face on the map did not come from a quote or a survey response, take it off. Unsourced emotion destroys credibility.
An opportunity without an owner, a metric and a date is a wish. That column is where the map becomes a plan.
Map the channels you do not own. Reviews, comparison sites and word of mouth are where journeys frequently break.
Most customer journey maps fail for the same reason: they are drawn from the inside. A team sits in a room, sketches the steps it believes a customer takes, colour-codes the emotions it assumes they feel, and produces a diagram that describes the company's process rather than the customer's experience.
A map earns its keep when it is built from evidence and ends in a decision. Everything else is a poster.
This guide covers what a journey map is, the components that belong on one, the four types and when to use each, the data you need, a nine-step process for building one, and how to turn the finished map into work people actually do.
What a customer journey map is
A customer journey map is a visual record of how a specific customer type moves toward a specific goal, showing what they do at each stage, where they do it, how they feel about it, and where the experience breaks. It is a research artefact, not a design mock-up, and its value comes from the evidence underneath it.
Journey, journey map and funnel
- The customer journey is what actually happens, including the parts you cannot see. It exists whether or not anyone maps it.
- The journey map is your documented understanding of that journey for one persona pursuing one goal. It is always a simplification and always incomplete.
- The funnel is your view of the same territory, measured in conversion. It tells you where people drop out. The map tells you why.
What a journey map is not
It is not a process diagram of your internal workflow, which is a service blueprint and belongs in a different exercise. It is not a lifecycle chart with stage names and no evidence. And it is not finished once it is drawn: a map that is not revised after a product or pricing change is actively misleading within about two quarters.
The components of a customer journey map
Different templates arrange these differently, but the same nine elements appear on every map worth reading.
Personas
One persona per map. Mapping several at once produces a diagram that is true of nobody. If two personas diverge materially, that is two maps, and the divergence point is usually the most interesting finding in the exercise.
Stages
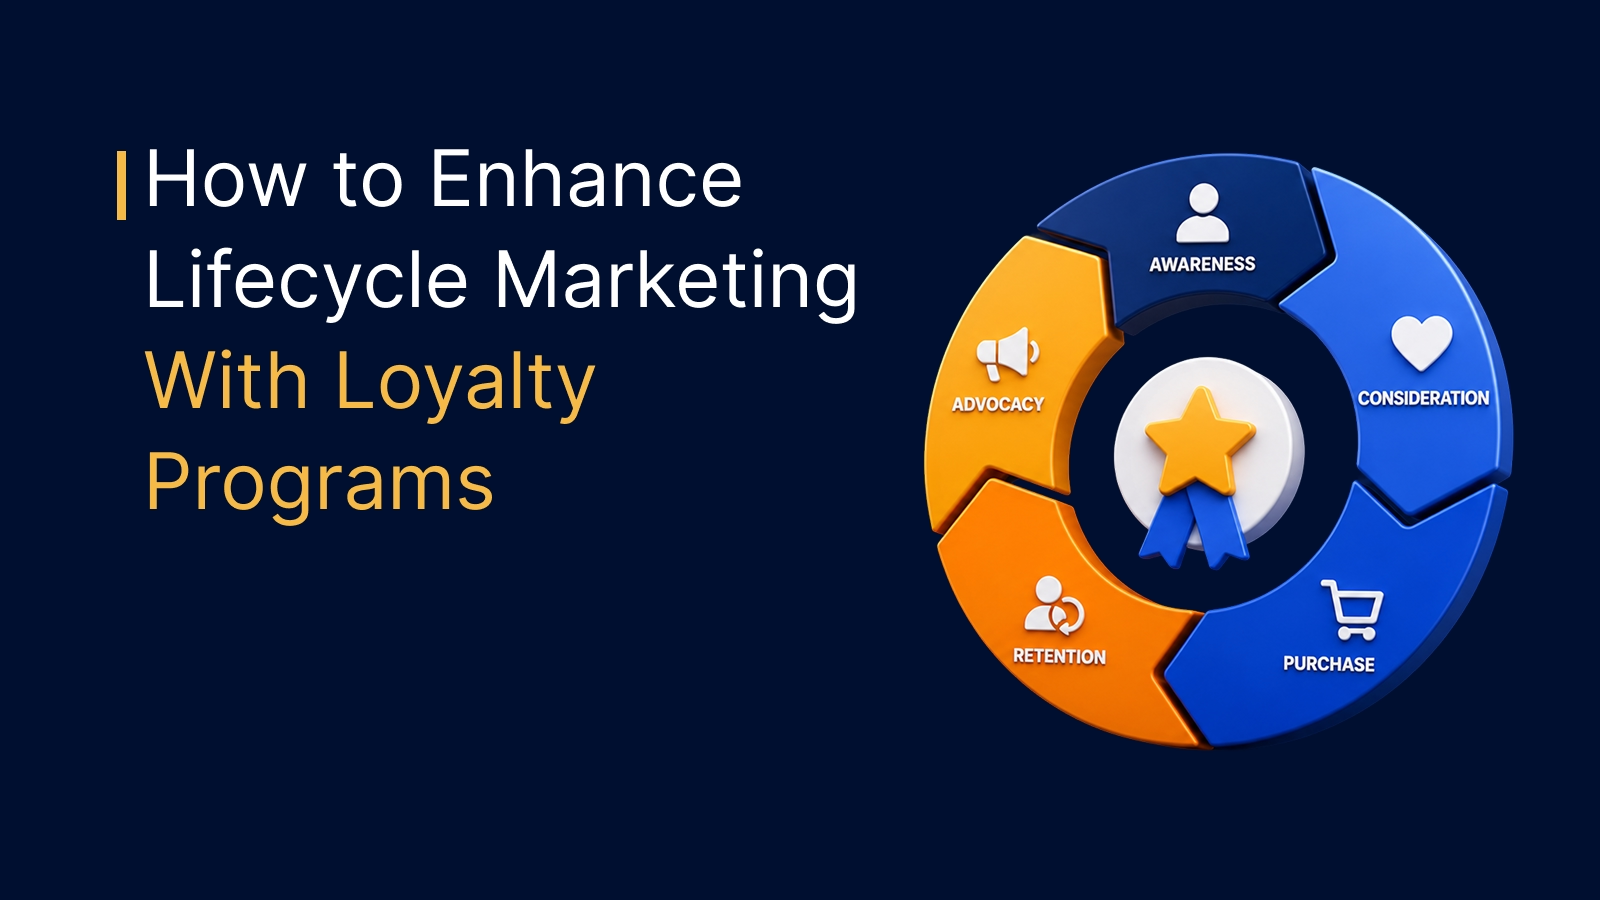
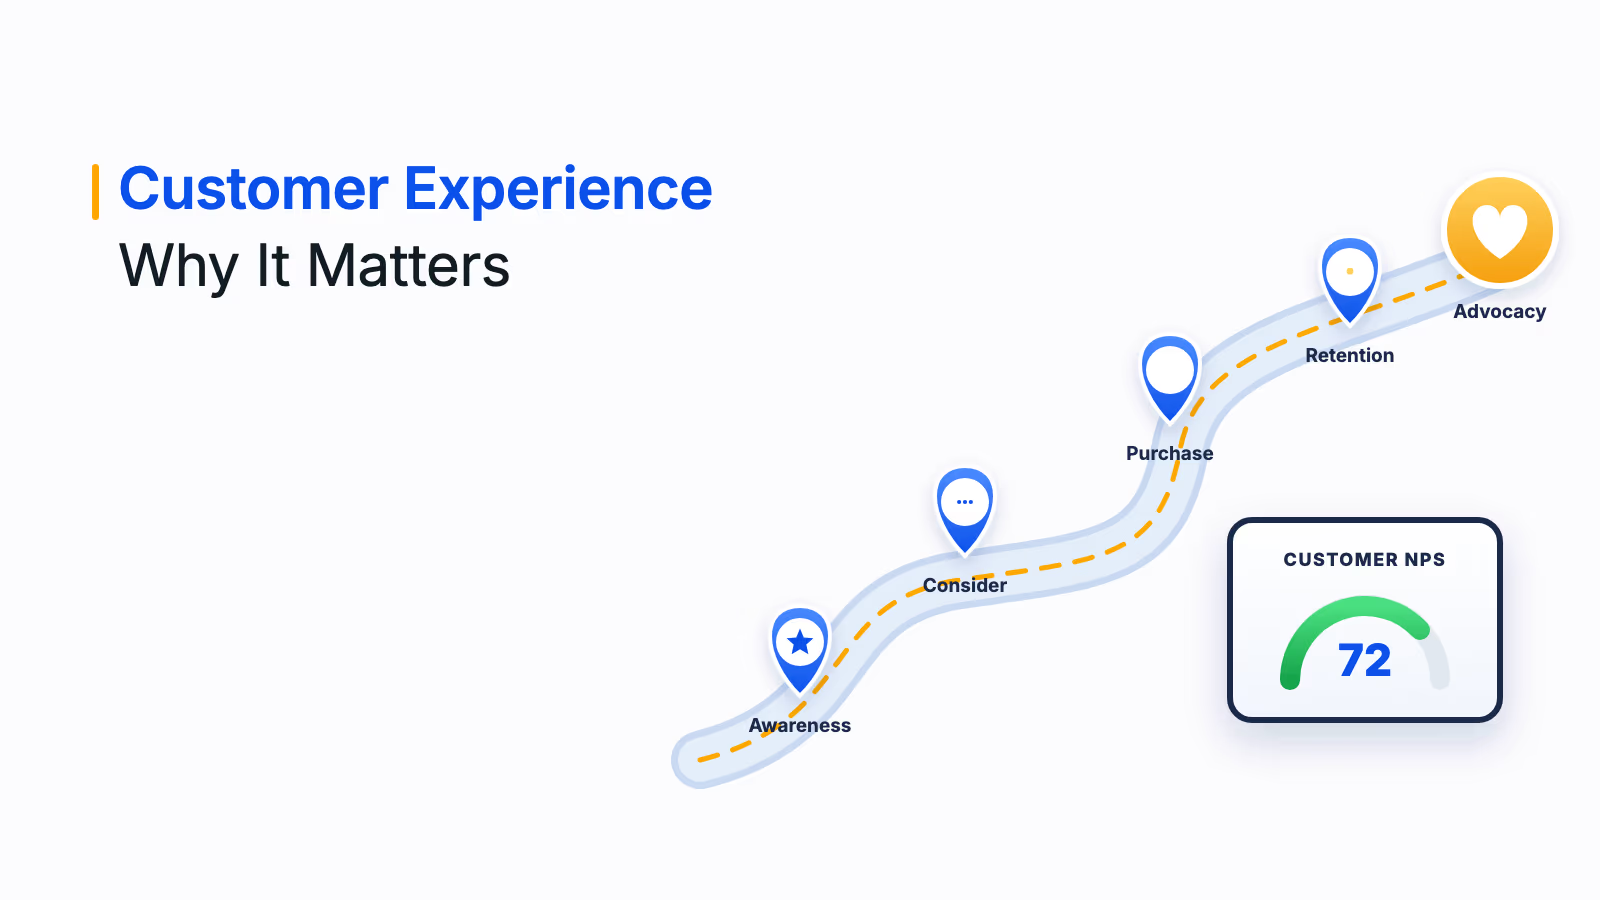
The commonly used sequence is awareness, consideration, decision, retention and advocacy, usually grouped into pre-purchase, purchase and post-purchase. Names vary between frameworks and it does not matter much which you use, as long as the stages reflect how your customers describe their own progress rather than how your org chart is divided.
Touchpoints and channels
Touchpoints are the moments of interaction. Channels are where they happen: site, app, store, email, support line, a review site you do not control, a conversation with a colleague. Listing only the channels you own is the most common way a map ends up flattering the business.
Actions, thoughts and emotions
What the customer does, what they are trying to work out, and how they feel while doing it. Emotion is the component teams most often invent. If a smiley face on the map did not come from a quote, an interview or a survey response, take it off.
Pain points and opportunities
The friction at each stage, and the specific change that would remove it. An opportunity that is not attached to an owner and a measure is a wish. This column is where the map either becomes a plan or stays a poster.
Metrics
Each stage needs a number so you can tell whether a change worked: drop-off at a step, time to complete, contact rate, satisfaction after an interaction, repeat rate afterwards. Without metrics the map cannot be evaluated, only admired.
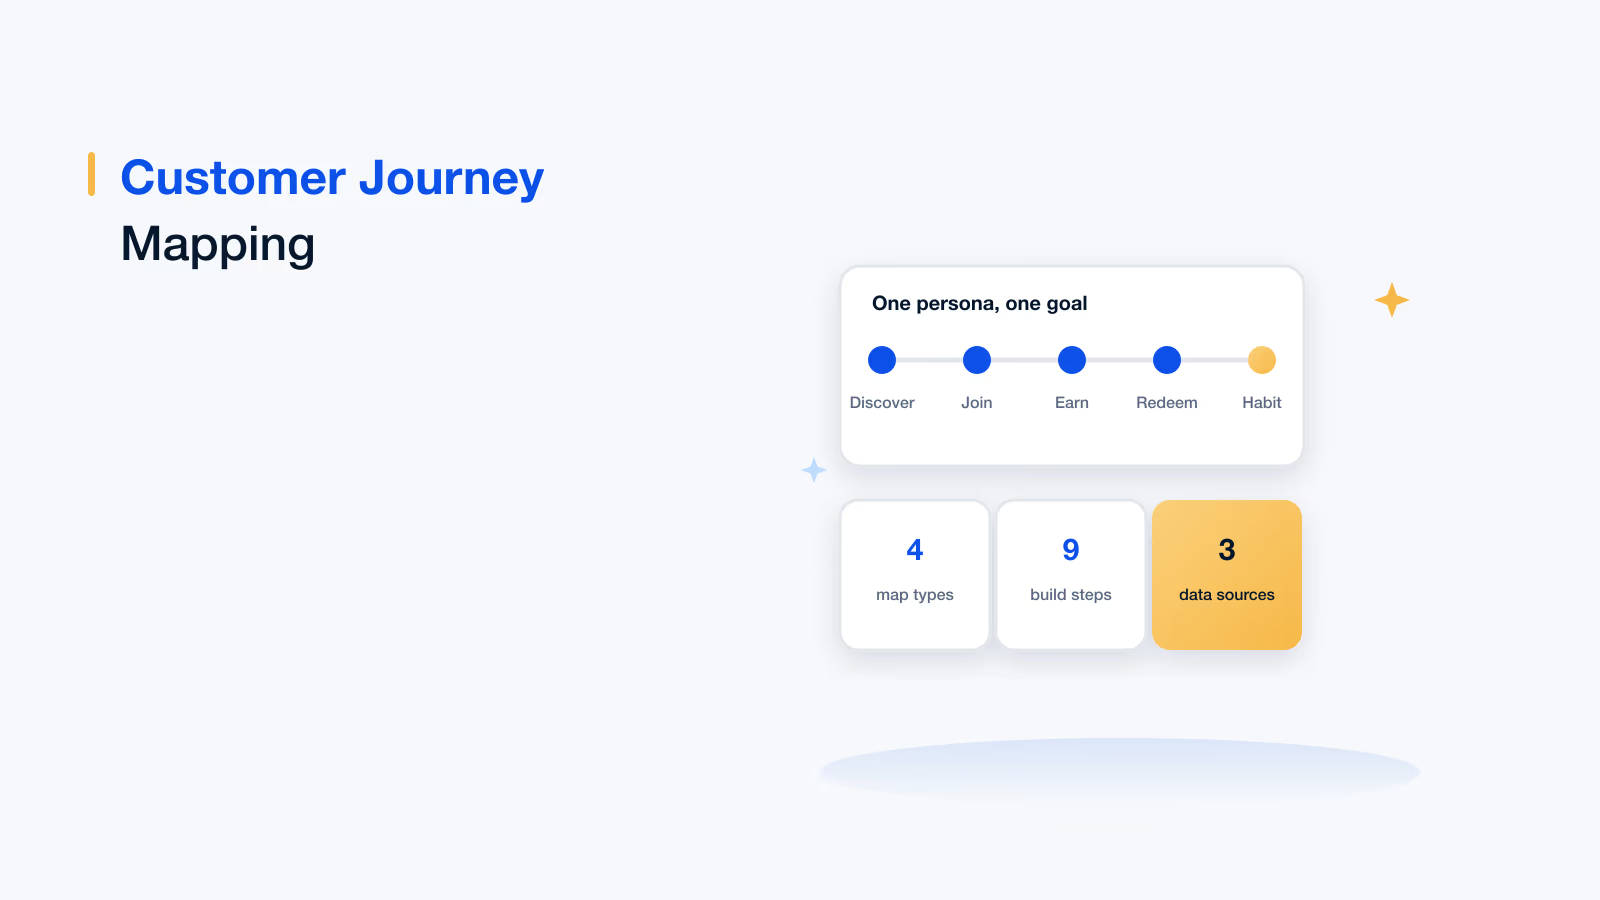
1
Persona per map
more than one and it is true of nobody
4
Map types
current, day in the life, future, blueprint
9
Steps to build one
ending in a decision, not a diagram
The four types of customer journey map
| Type | What it shows | Use it when |
|---|---|---|
| Current state | How the journey works today, with real friction | You need to find and fix problems. The default starting point |
| Day in the life | The customer's wider day, including everything unrelated to you | You need context on where you fit and how much attention you get |
| Future state | How the journey should work after a change | You are designing a new experience, launch or redesign |
| Service blueprint | The front-stage experience plus the staff, systems and processes behind it | You know what to fix and need to see what has to change internally |
Current state maps
The workhorse. Built entirely from evidence about what happens now, including the parts that embarrass the business. If you only ever build one type, build this one, and resist the urge to clean it up before showing it.
Day in the life maps
Widens the frame to the customer's whole day, not just their interactions with you. Its value is proportion: it usually reveals that the moment your team treats as central occupies about ninety seconds of someone's week.
Future state maps
A design artefact rather than a research one. Useful for aligning teams on a target experience before a build, dangerous if it is mistaken for how things work today. Label it clearly.
Service blueprints
Extends the map downward, linking each customer action to the front-line staff, back-office processes and systems that support it. This is where a journey insight becomes an operational change, which is why a blueprint is usually the second artefact rather than the first.
Map the journey on real behaviour
Timestamped earn, redemption and engagement events per member, so the map rests on evidence rather than assumption.
Book a demoTrusted by 5,000+ companies
The data a journey map needs
A map is only as good as its inputs. Three kinds of evidence, and you want all three.
Solicited data
- Customer interviews: The highest-value input and the one teams skip. Six to eight interviews per persona surfaces most of the friction.
- Surveys: Good for sizing something you learned in interviews, poor for discovering it.
- Post-interaction feedback: CSAT or CES collected at a specific step, which anchors emotion to a moment rather than to a vibe.
- Front-line staff input: Support and sales teams hear the same complaints daily and are the cheapest research you have.
Unsolicited data
- Support tickets and call reasons: A ranked list of what the journey is doing wrong, already written down.
- Reviews and social posts: Uncomfortable, unfiltered, and often about a step nobody internally considers part of the journey.
- Search queries on your own site: What people could not find, which is a map of your navigation failures.
- Session recordings and heatmaps: Where people hesitate, backtrack or abandon.
Operational data
Analytics funnels, drop-off rates, time between steps, repeat purchase intervals, channel mix. This is what turns a qualitative map into something you can measure a change against.
How to create a customer journey map
Nine steps, with the research front-loaded for a reason. A workshop held before the evidence is gathered will document the team's assumptions very efficiently.
1. Set one objective
Write down what decision this map will inform. "Reduce first-month churn", "cut support contacts in onboarding", "raise loyalty enrolment at the counter". A map built without a decision in mind produces findings nobody is accountable for.
2. Choose one persona and one goal
Narrow is better. The new customer completing their first purchase. The lapsed member deciding whether to come back. One persona, one goal, one map.
3. Gather the evidence before drawing anything
Interviews, tickets, reviews, analytics. Resist the workshop until you have this, because the workshop will otherwise just document assumptions efficiently.
4. List every touchpoint, including the ones you do not own
Comparison sites, review platforms, a colleague's recommendation, a delivery partner's tracking page. The touchpoints outside your control are frequently where the journey actually breaks.
5. Walk the journey yourself
Buy the product. Submit the support request. Join the loyalty programme at the counter. Do it on a phone, on a bad connection, without an internal account. This single step finds more friction than any workshop, and it is the one most often skipped.
6. Plot actions, emotions and pain points against the stages
Only enter what the evidence supports. Mark the gaps as gaps rather than filling them with reasonable guesses, because the gaps tell you where to research next.
7. Identify the moments that matter
Not every step deserves attention. Look for the steps with the highest drop-off, the highest emotional load, or the highest contact rate. Three to five of these will carry most of the available improvement.
8. Turn opportunities into owned actions
Each one gets a named owner, a target metric and a date. This is the step that separates a map that changes something from a map that gets laminated.
9. Review and revise on a schedule
Set a review after every significant product, pricing or channel change, and at minimum twice a year. An unrevised map ages into a confident description of a journey that no longer exists.
A worked example: the loyalty member journey
| Stage | Customer action | Common friction | What to measure |
|---|---|---|---|
| Discover | Sees the programme at checkout or on a receipt | Benefit stated as mechanics, not value | Offer impression to enrolment rate |
| Join | Enters a phone number or email | Form asks for more than it needs; app download required | Enrolment completion rate |
| First earn | Makes a qualifying purchase | Points not visible, or credited days later | Share of members with a first earn in 30 days |
| First redeem | Reaches and uses a reward | Threshold too high; catalogue thin; redemption buried | Time to first redemption |
| Habit | Returns and earns repeatedly | No reason to open the app between purchases | Active member share, monthly |
| Lapse | Stops engaging | No trigger detects it; win-back arrives too late | Lapse rate and win-back response |
Mapped this way, the pattern is usually the same: enrolment is healthy, first earn is acceptable, and the journey collapses between first earn and first redemption. That is a finding you can act on, and it is invisible in an enrolment report.
Best practices
- Start with the current state: Fix what is broken before designing what is ideal.
- Keep one persona per map: Combining them produces an average customer who does not exist.
- Quote real customers on the map: A verbatim does more to move a stakeholder than a colour-coded emotion curve.
- Include the channels you do not own: Reviews, comparison sites and word of mouth are part of the journey whether you map them or not.
- Attach a metric to every stage: Otherwise you cannot tell whether a change helped.
- Make it accessible to other teams: Support, product, operations and marketing all act on different parts of the same map.
- Revisit after every major change: A stale map is worse than no map, because people trust it.
Common mistakes
- Building it in a workshop with no research: You will efficiently document what the team already believes.
- Mapping your process instead of their experience: If the stages match your internal handoffs, you have drawn an org chart.
- Inventing the emotions: Unsourced sentiment is the fastest way to lose credibility with the people who talk to customers daily.
- Mapping every persona at once: The result is true of nobody and actionable by no one.
- Stopping at the diagram: Opportunities without owners, dates and measures do not become work.
- Ignoring post-purchase: Most loyalty value and most churn risk sit after the transaction, which is exactly where most maps thin out.
- Treating it as a one-off project: The journey changes every time you change the product.
Turning the map into action
Three outputs make a journey map operational. A ranked list of moments that matter, with evidence attached. An owner and a target metric for each. And a review date tied to the next product change. Without those three, the map is a communication artefact rather than a management one.
From there the work usually divides between experience fixes, which belong to product and operations, and contact strategy, which belongs to marketing and loyalty. Our guides to customer engagement strategies and customer loyalty analytics cover each side.
Journey mapping with Loyalife
01 · Identity
One customer across channels
Identity resolution so a member is one person whether they buy in store, online or through the app, which is the precondition for an accurate map.
02 · Evidence
Behavioural data at every stage
Earn, redemption and engagement events timestamped per member, so the map rests on what happened rather than what was assumed.
03 · Moments
Triggers at the points that matter
Automated actions on first earn, approaching a reward threshold and lapse, which is where journey findings turn into contact.
04 · Measurement
Stage-level metrics
Time to first redemption, active member share and lapse rate reported continuously rather than reconstructed for a review.
05 · Segments
Persona-level views
Behavioural segmentation so each persona's journey can be measured separately instead of averaged together.
06 · Proof
Control group reporting
Member versus holdout comparison, so a journey change can be shown to have caused the improvement.
You can also explore loyalty programs and the Loyalife platform.
A good journey map is uncomfortable to look at and short-lived by design. If yours is flattering and two years old, it is describing a company rather than a customer.
Book your Loyalife demo
Frequently asked questions
A visual record of how one customer type moves toward one goal, showing what they do at each stage, which channels they use, how they feel, where the experience breaks, and what could be improved. It is a research artefact rather than a design mock-up, and its value comes entirely from the evidence underneath it.
Nine elements: one persona, the stages of the journey, touchpoints, channels, customer actions, their thoughts, their emotions, the pain points at each stage, and the opportunities to fix them. Each stage should also carry a metric, because without numbers the map can be admired but not evaluated.
Four. Current state, which shows how the journey works today and is the usual starting point. Day in the life, which widens the frame to the customer's whole day. Future state, which shows how a redesigned journey should work. And a service blueprint, which extends the map downward to the staff, systems and processes behind each customer action.
Set one objective tied to a decision, pick one persona and one goal, gather evidence before drawing anything, list every touchpoint including the ones you do not own, walk the journey yourself, plot actions and emotions against stages using only what the evidence supports, identify the three to five moments that matter, give every opportunity an owner and a metric, and set a review date.
Three kinds. Solicited data such as customer interviews, surveys, post-interaction feedback and front-line staff input. Unsolicited data such as support tickets, reviews, on-site search queries and session recordings. And operational data such as funnel drop-off, time between steps and repeat purchase intervals, which is what lets you measure whether a change worked.
One. A map covering several personas describes an average customer who does not exist and produces findings nobody can act on. If two personas diverge materially, build two maps. The point at which they diverge is usually the most useful thing the exercise reveals.
After every significant product, pricing or channel change, and at minimum twice a year. A map that is not revised ages into a confident description of a journey that no longer exists, which is more dangerous than having no map at all because people continue to trust it.
A journey map describes the customer's experience, front-stage. A service blueprint adds everything behind it: the front-line staff actions, back-office processes and systems that make each step possible. The blueprint is usually the second artefact, built once the map has identified which moments need fixing and you need to know what has to change internally.
Most commonly because they were built in a workshop with no research, which documents the team's assumptions efficiently. Other frequent causes: mapping internal process instead of customer experience, inventing the emotions, covering every persona at once, thinning out after the purchase where most churn risk lives, and stopping at the diagram without owners, metrics or dates.