Key Takeaways
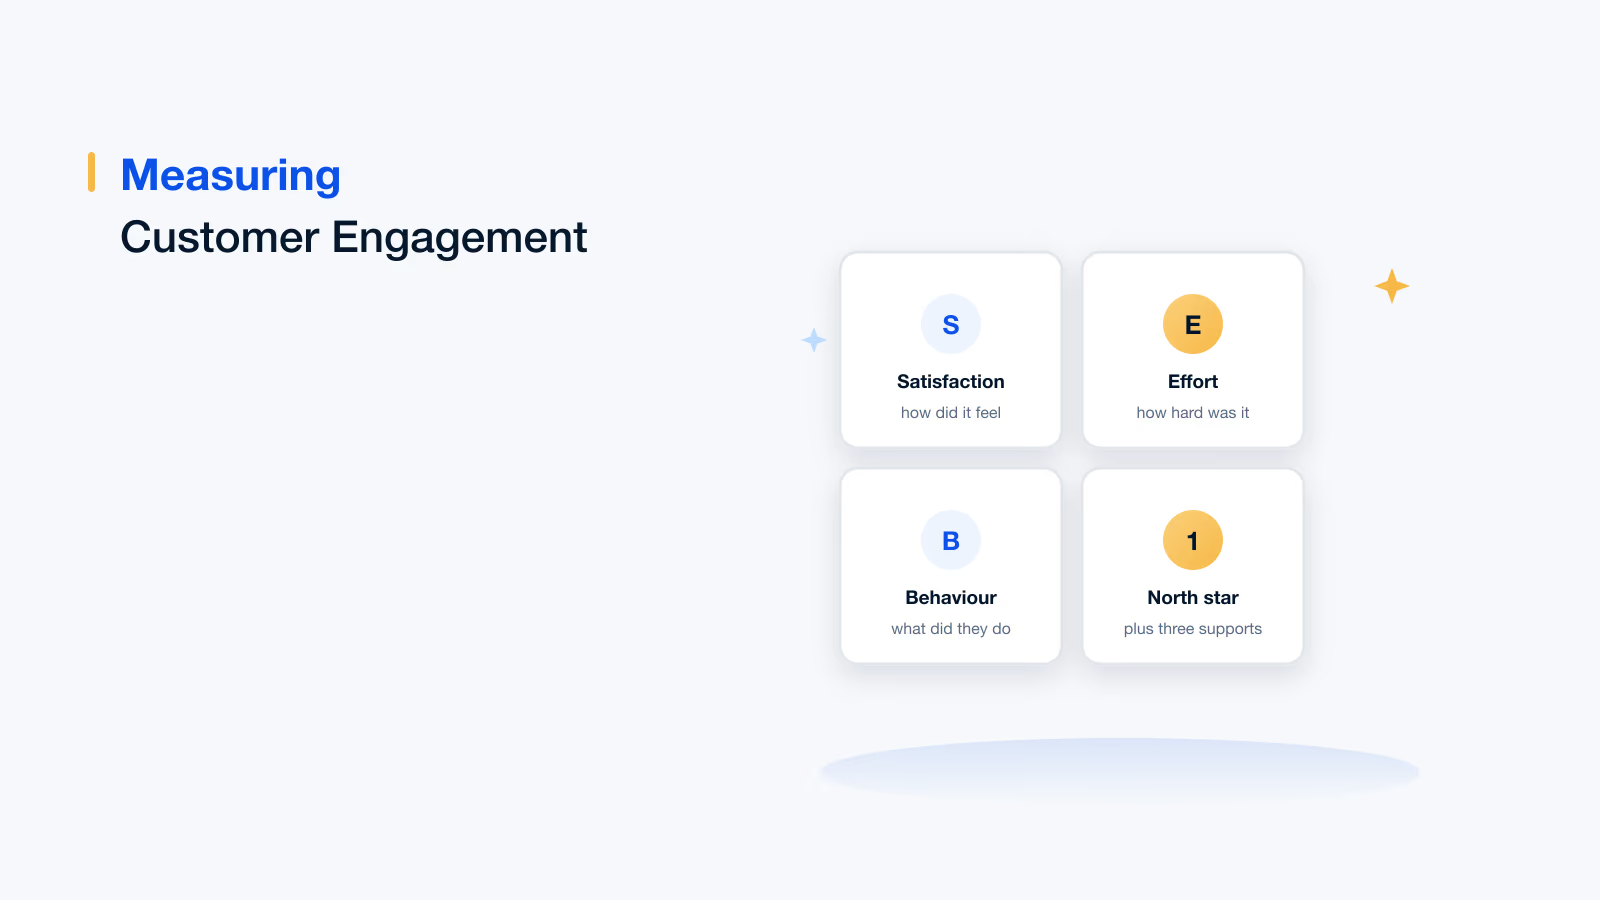
Satisfaction asks how it felt, experience asks how hard it was, engagement asks what they are choosing to do. Only the third predicts anything.
If a metric improves when you send more messages, it measures your activity rather than the customer's engagement.
Effort predicts churn better than satisfaction. Customers rarely leave for insufficient delight; they leave because something was difficult.
Satisfaction can stay high while the base disengages, because departing customers stop interacting and stop responding first.
Define engagement from your own churn data. The behaviour that separates stayers from leavers differs by business.
Any metric attached to an incentive will be optimised in ways you did not intend. Audit for gameability every year.
Engagement, experience and satisfaction are measured by three different teams, using three different instruments, and reported as if they were the same thing. They are not, and the confusion is why so many organisations can show green dashboards while losing customers.
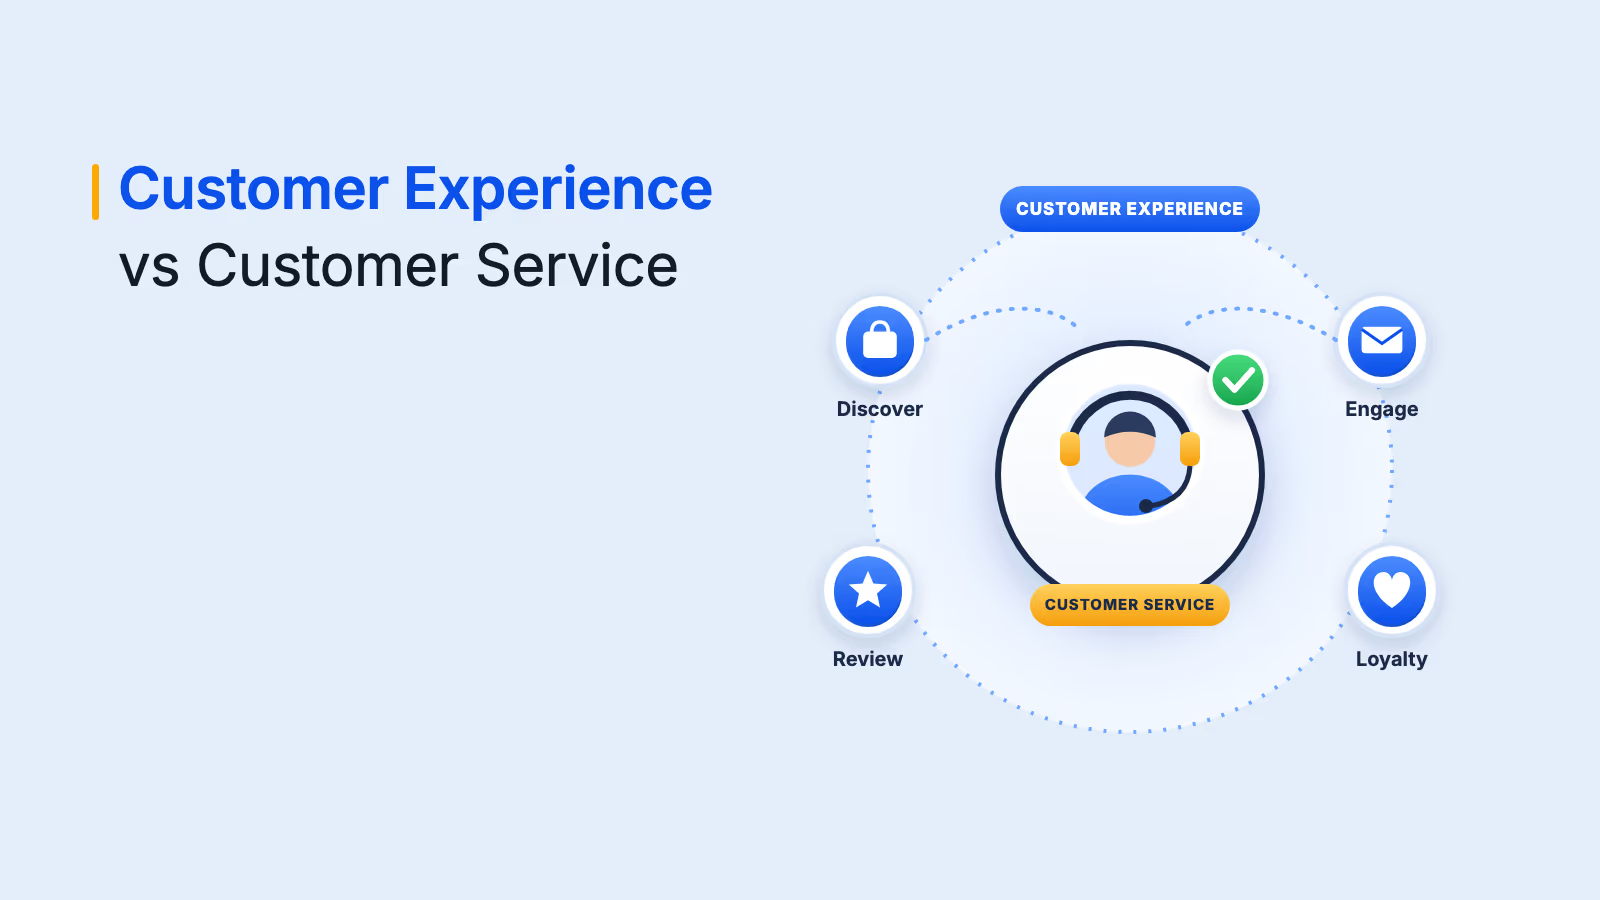
Satisfaction tells you how an interaction felt. Experience tells you how hard it was. Engagement tells you what the customer is choosing to do. Only the third one predicts anything, and it is the one measured worst.
This guide covers what each measures, the metrics in each family, how to build a measurement framework that cannot be gamed, the survey design traps, and what to report to whom.
Three different things, three different instruments
| Satisfaction | Experience | Engagement | |
|---|---|---|---|
| Question it answers | How did that feel? | How hard was that? | What are they choosing to do? |
| Direction | Backward looking | Backward looking | Current and predictive |
| Typical instrument | CSAT, NPS | Customer effort score, journey analytics | Behavioural data |
| Main weakness | Can be high while customers leave | Only covers interactions you measured | Easily faked with vanity metrics |
| Who usually owns it | Service | CX or product | Marketing, often nobody |
The practical rule: use satisfaction and effort to diagnose specific interactions, and use behavioural engagement to predict and to steer. Reporting a satisfaction score as the health of the customer base is the most common measurement error in this area.
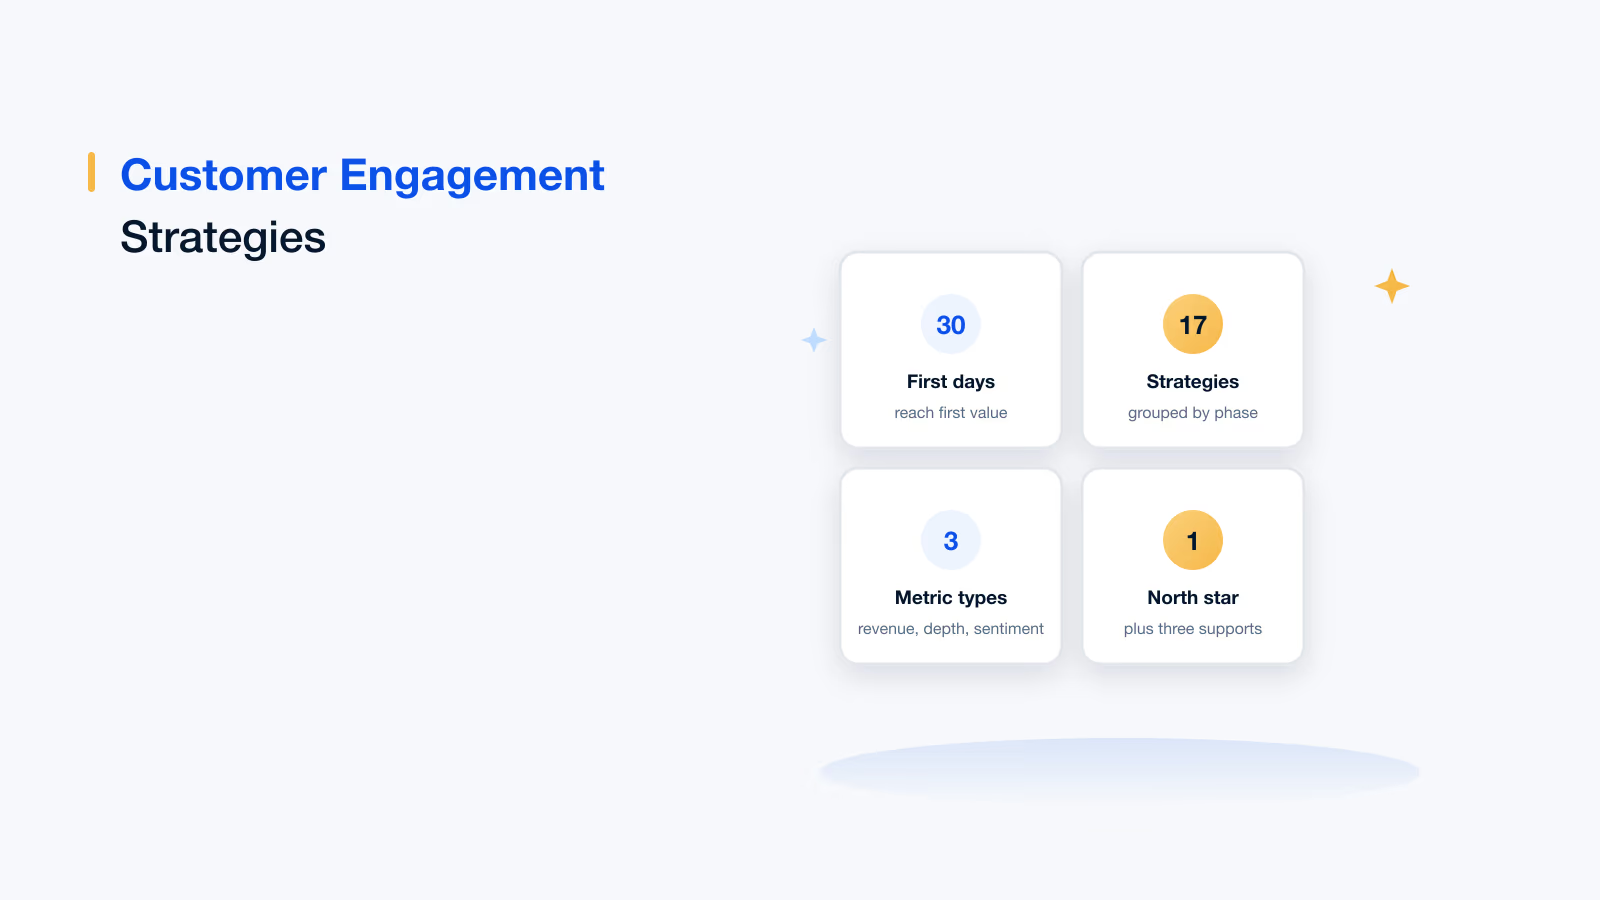
3
Distinct things to measure
not one number
1
Test for any metric
does it predict revenue or churn
0
Value in a survey nobody acts on
it is worse than not asking
Measuring engagement
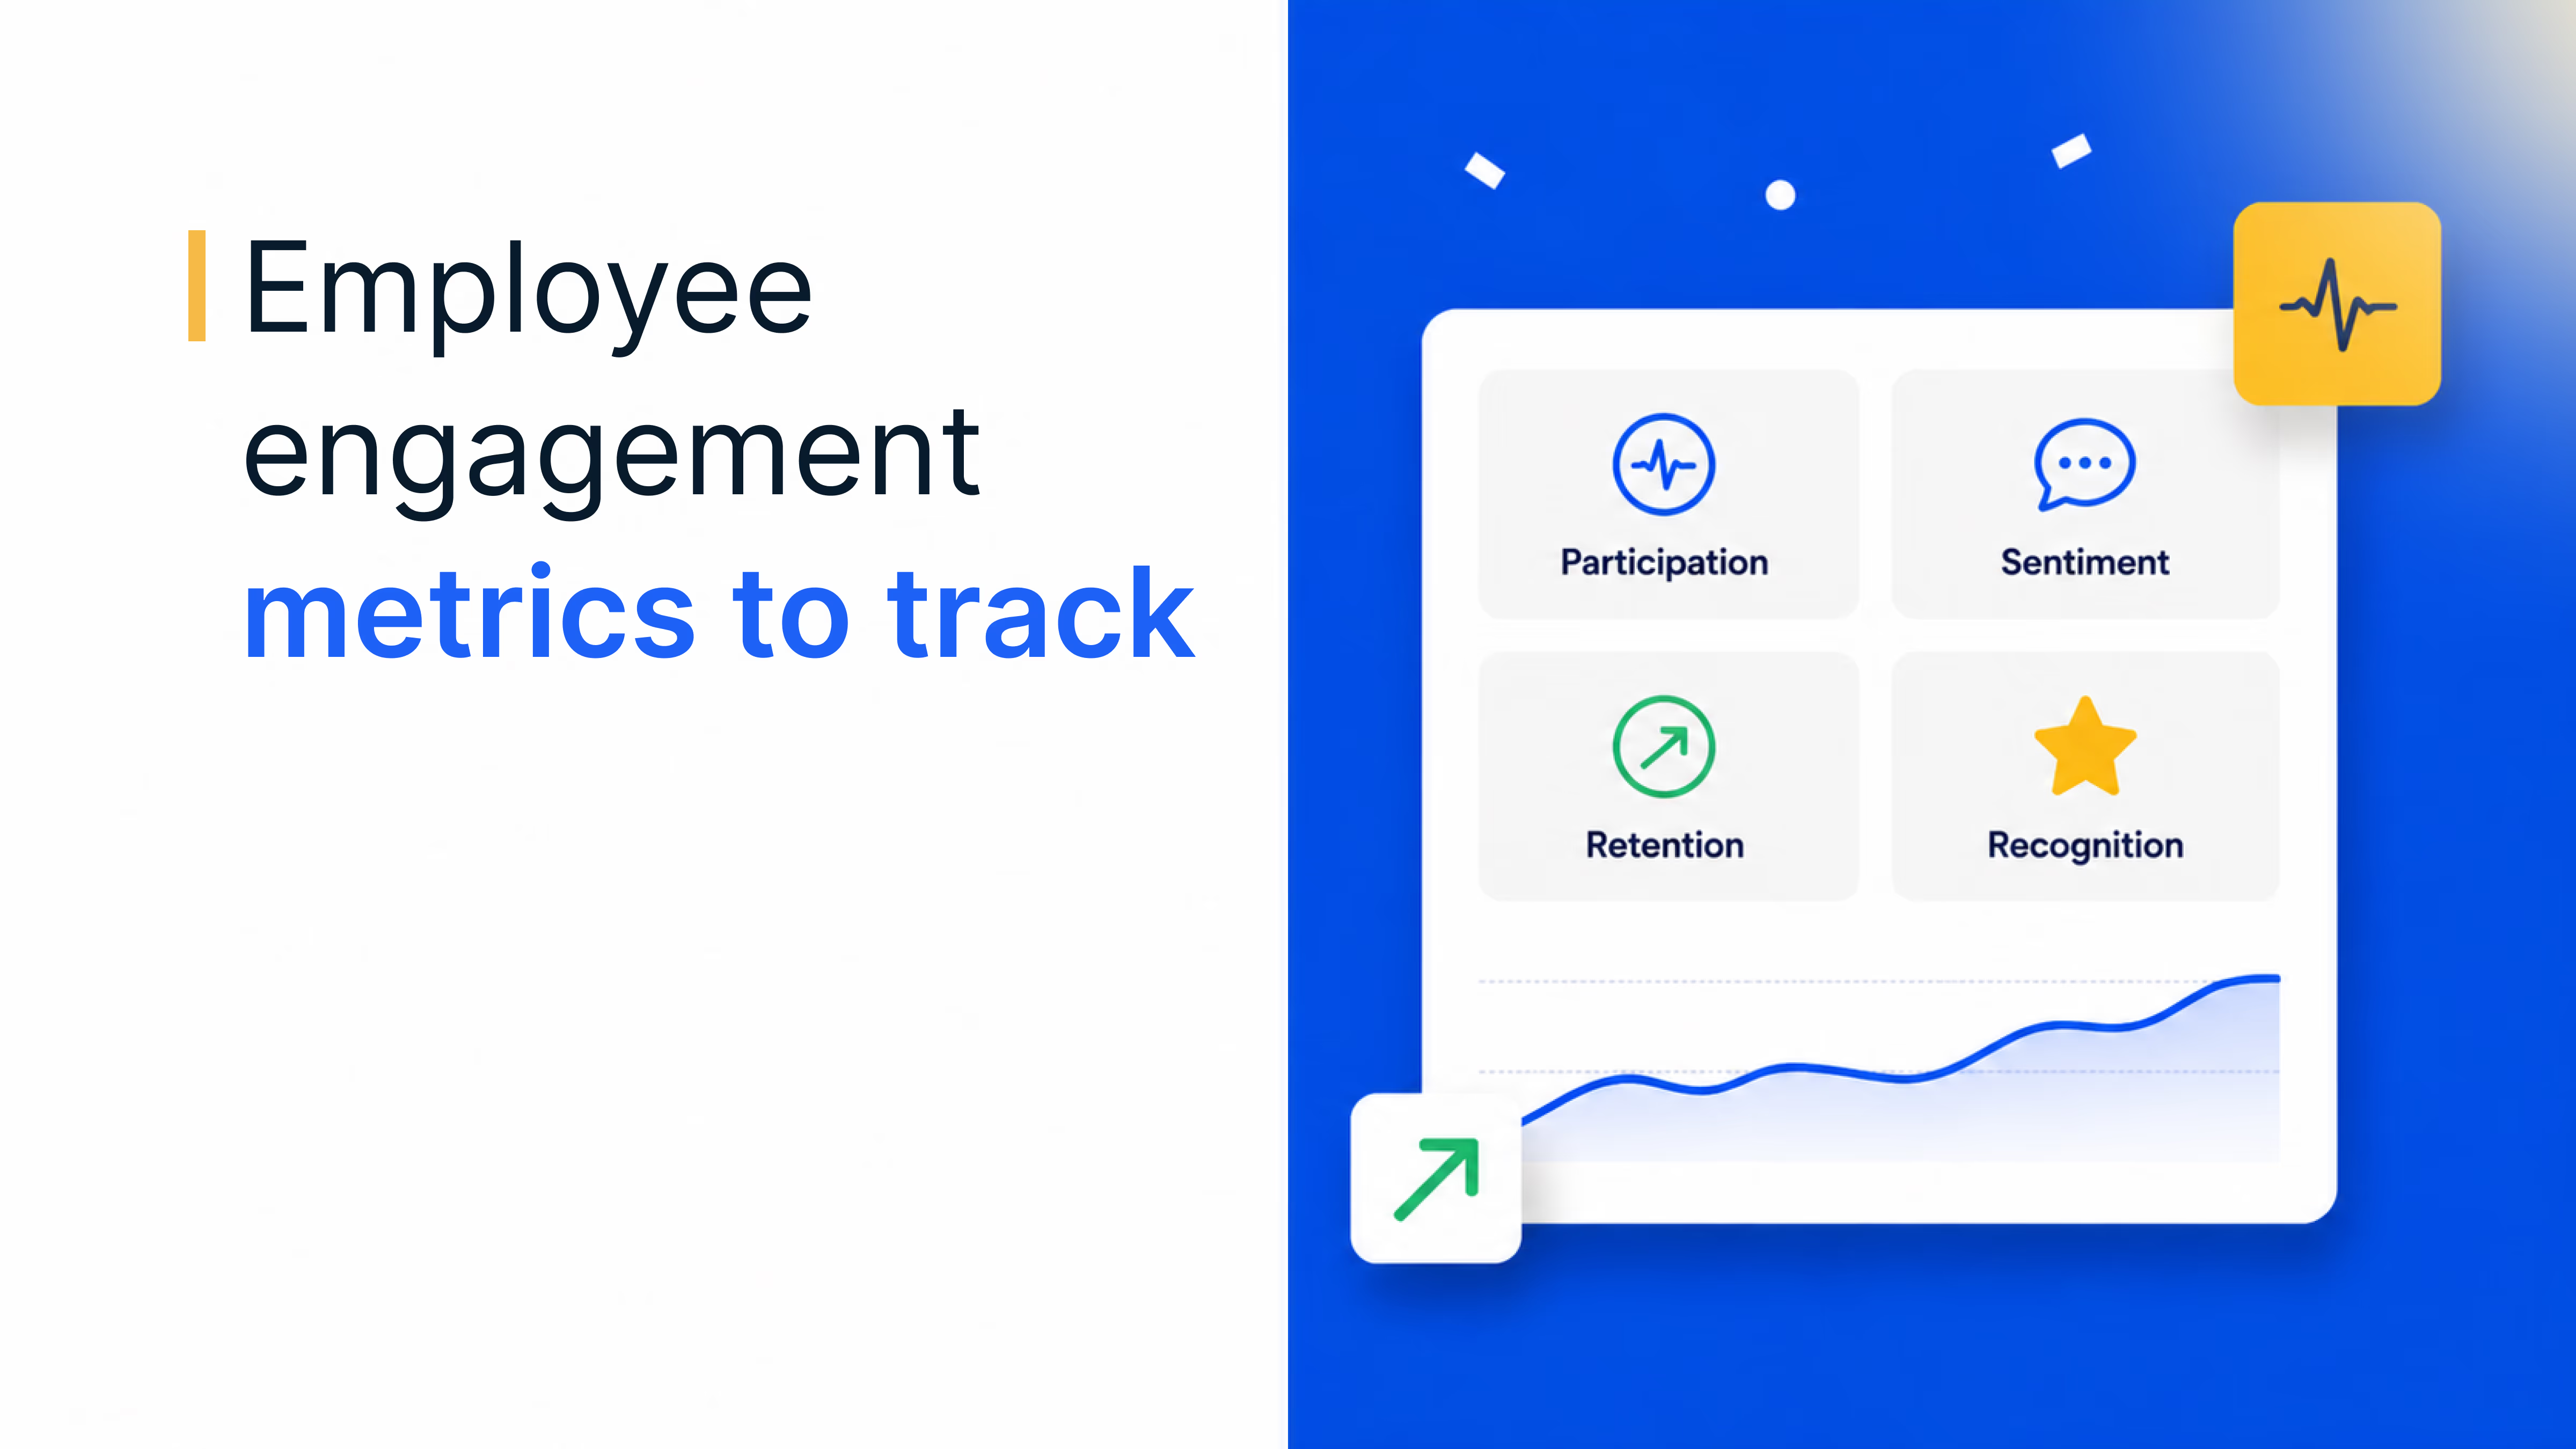
Engagement is behavioural, which makes it the only family that can be measured without asking anyone anything. Define it from your own data rather than from a template.
Find your engagement definition
Compare customers who stayed with customers who left, in their first weeks, and find the behaviours that separate them. In one business it is a second purchase inside sixty days; in another it is a feature adopted in week one. Everything downstream depends on getting this specific to you.
Depth metrics
- Active customer share: How much of the base has a live relationship, which is the headline engagement number.
- Frequency and interval: How often, and whether that interval is lengthening per customer.
- Breadth: Categories, products or features used, which is the strongest retention correlate in most businesses.
- Programme participation: Earning and redemption activity, which is engagement you can measure precisely.
- Channel count: Customers who use more than one channel are consistently harder to lose.
Metrics to demote
Open rate, click rate, session count, time on site and follower numbers. All are legitimate diagnostics for a specific message or page. None is an engagement measure, because every one of them can be improved by sending more and several can be improved by annoying people. If a metric rises when you increase message volume, it is measuring your activity rather than the customer's.
Measure behaviour, not just opinion
Active share, frequency, breadth and redemption per member, measured against a holdout.
Book a demoTrusted by 5,000+ companies
Measuring experience and effort
Experience measurement asks how hard it was to get something done. Customer effort score is the most useful single instrument here, because effort predicts churn more reliably than satisfaction does: customers rarely leave because they were delighted insufficiently, but they leave regularly because something was difficult.
- Ask at the moment, about the moment: Effort questions work immediately after a specific interaction and are nearly meaningless in a general annual survey.
- Pair the score with the operational data: Handle time, contacts to resolution and reopen rate explain the score in a way the score alone cannot.
- Measure the journey, not the touchpoint: A sequence of individually acceptable steps can still add up to an unacceptable experience.
- Watch the silent failures: Abandoned baskets, failed searches and self-service dead ends generate no survey response and a great deal of churn.
Measuring satisfaction
Satisfaction instruments are the oldest and the most abused. They are useful when attached to a specific interaction and actively misleading when used as a headline business metric.
CSAT
Fine for a transaction or interaction. It should be asked immediately, about one thing, and read as a diagnostic. A rolling CSAT average across an organisation mostly measures response bias.
NPS
Useful as a tracked trend with verbatim comments attached, and misused everywhere else. The score is sensitive to sampling, timing and culture, and it moves for reasons unrelated to anything you did. Treat the comments as the valuable part and the number as a rough index.
Why satisfaction can be high while customers leave
Because satisfaction measures the interactions people had, and departing customers stop having interactions first. A base quietly disengaging generates fewer surveys from fewer people, and the ones who still answer are the ones who still care. This is why a satisfaction-led dashboard can look healthy right up to the point it does not.
Building a measurement framework
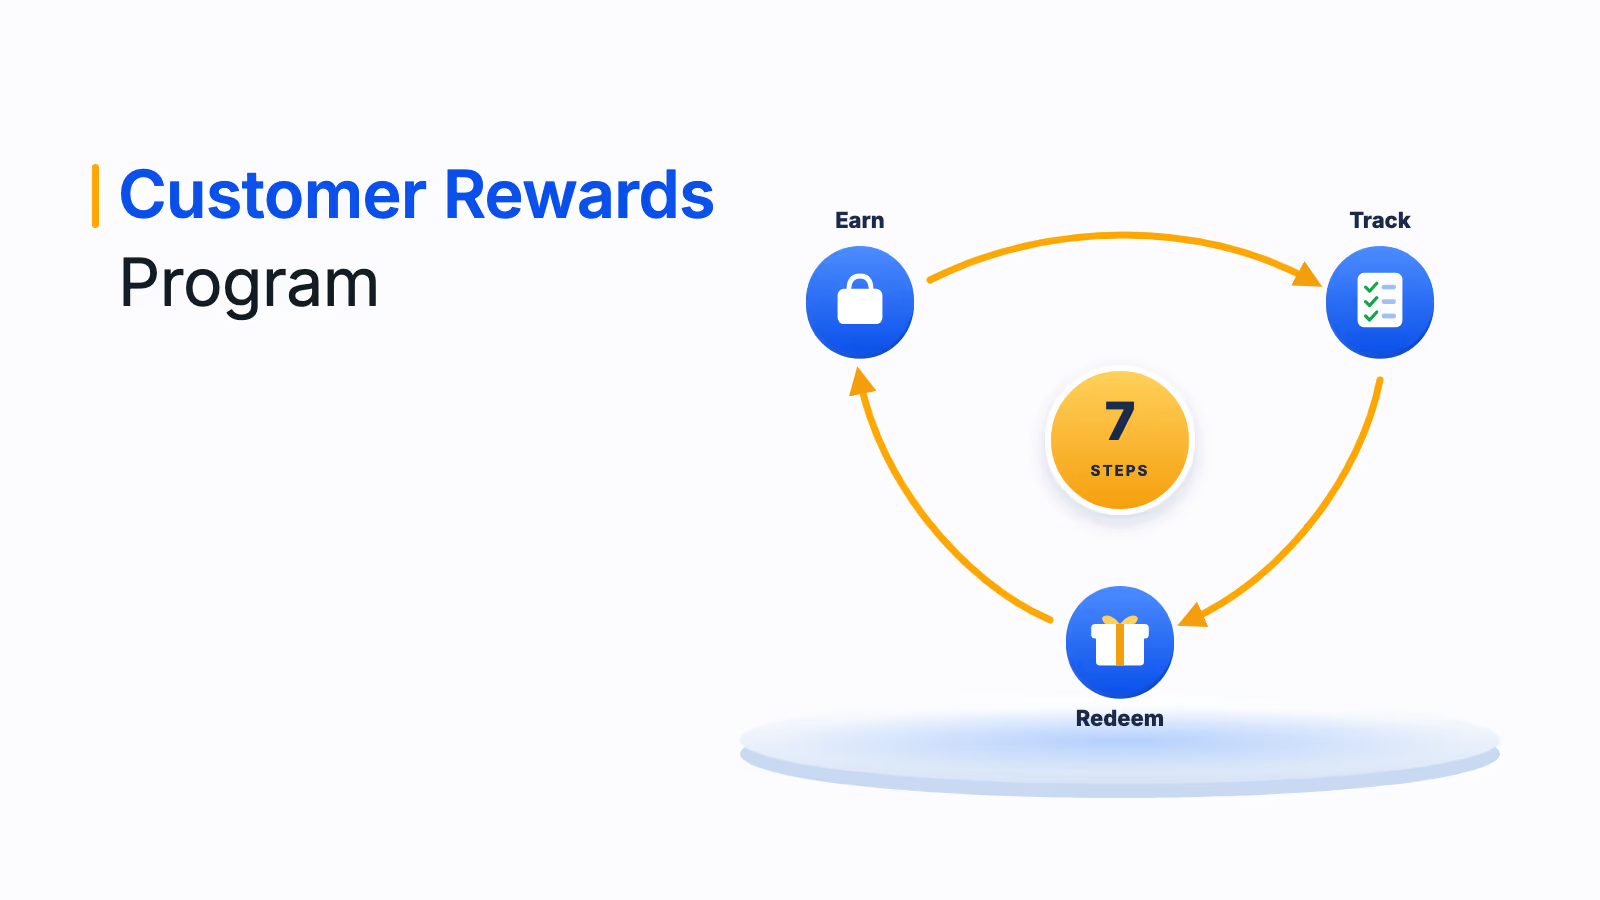
Seven steps that produce a framework people act on rather than admire. The last one matters more than it looks, because any metric tied to an incentive eventually gets optimised.
1. Pick one north-star metric
A customer health score or active member share, defined from your own churn data. One number that the organisation agrees represents the state of the customer base.
2. Support it with three, covering different failure modes
One revenue metric, one depth metric, one sentiment or effort metric. Three is enough to stop a gain in one hiding a loss in another, and few enough that people remember them.
3. Instrument behaviour before opinion
Behavioural data is continuous, unbiased by response rates and available for every customer, including the ones who would never answer a survey. Surveys explain what behaviour tells you; they should not be the primary signal.
4. Design surveys that can be acted on
Short, immediate, specific to one interaction, with a free-text box and a route back to a human. Anything longer gets answered by the unrepresentative minority with time.
5. Close the loop visibly
Act on feedback and publish what changed. Collecting feedback and changing nothing teaches customers the dialogue is decorative, which depresses future response rates and does real damage.
6. Report to each audience in its own terms
The board wants retention and lifetime value. Operations wants effort and resolution. Marketing wants active share and response. The same underlying data, framed three ways, beats one dashboard that satisfies nobody.
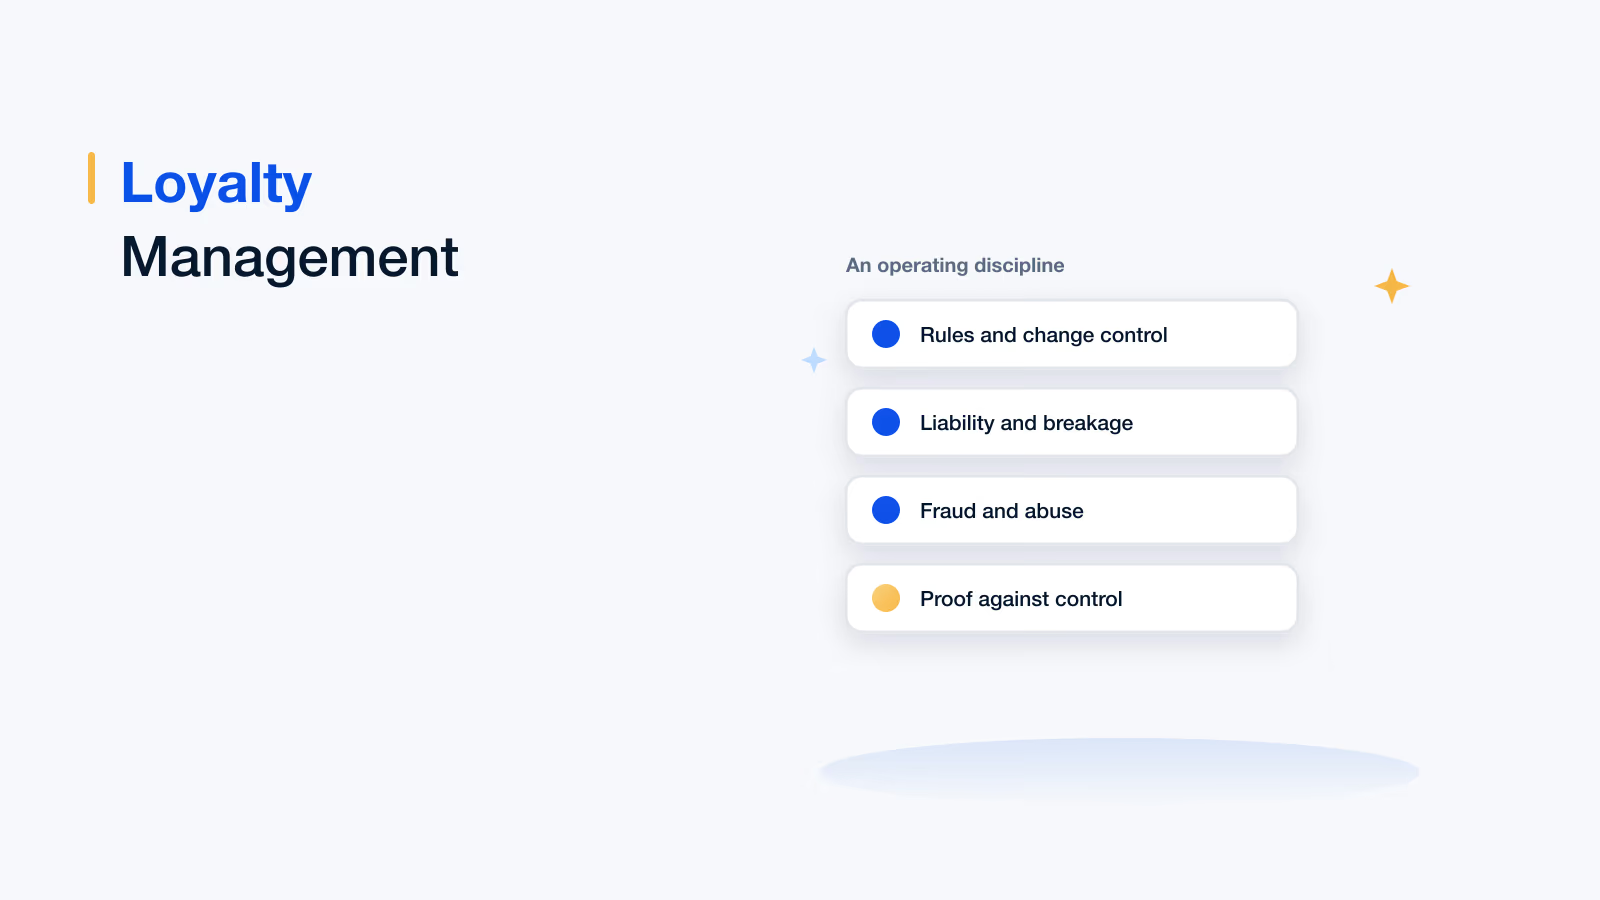
7. Audit for gameability every year
Any metric attached to an incentive will be optimised, including in ways you did not intend. Ask directly how each metric could be moved without helping a customer, and assume someone will eventually find that route.
Survey design traps
- Asking too late: Memory decays fast and the answer becomes about the brand in general rather than the interaction.
- Asking too much: Long surveys select for the unrepresentative minority with time to complete them.
- Leading questions: Any question whose wording suggests the expected answer produces a number you cannot use.
- Averaging across contexts: A score combining onboarding, support and delivery conceals all three.
- Incentivising the score: The fastest way to corrupt a measure, and it happens within one review cycle.
- Ignoring non-responders: The customers who do not answer are disproportionately the ones about to leave.
- Having no free-text box: The comment is almost always more useful than the number.
What to report
| Audience | Report | Why |
|---|---|---|
| Board | Retention by cohort, lifetime value, active share | Decisions about investment need a lifetime horizon |
| Operations | Effort score, contacts to resolution, reopen rate | These are directly actionable this week |
| Product | Feature and category adoption, time to first value | Where the experience creates or destroys engagement |
| Marketing | Active share, programme participation, incrementality | Whether the activity changed behaviour |
| Everyone | The north-star metric | One shared definition of how the base is doing |
Measurement on Loyalife
01 · Behaviour
Engagement from activity, not surveys
Earning, redemption, channel and category behaviour per member, continuously, for every customer rather than the ones who answer.
02 · Definition
Your own engagement definition
Behavioural segmentation built from what actually separated retained from churned customers in your data.
03 · Depth
Active share and breadth
Live relationship share, frequency, interval and category breadth reported as standard.
04 · Feedback
Sentiment tied to the member
Survey responses attached to the member record and the interaction, rather than sitting in a separate tool.
05 · Proof
Incrementality against holdout
The measure that separates programme effect from self-selection, built in rather than reconstructed.
06 · Reporting
One dataset, several views
Board, operations, product and marketing views from the same underlying member data.
You can also explore customer engagement strategies and the Loyalife platform.
If you measure one thing, measure what customers choose to do rather than what they say about it. Satisfaction explains behaviour after the fact. Behaviour is the only thing that warns you in time.
Book your Loyalife demo
Frequently asked questions
Satisfaction measures how an interaction felt and is backward looking. Experience measures how hard something was to get done, usually through effort scores and journey analytics. Engagement measures what the customer is actually choosing to do, which makes it the only one of the three that is current and predictive. They need different instruments and should not be reported as one number.
Behaviourally, from your own data. Start by comparing customers who stayed with those who left to find the behaviours that separate them, then track active customer share, frequency and interval per customer, breadth across categories or features, programme participation, and channel count. These are continuous, unbiased by response rates and available for every customer.
Because every one of them can be improved by sending more messages, and several can be improved by annoying people with misleading subject lines. They are legitimate diagnostics for a specific message or page, but as headline measures they report your activity rather than the customer's. The test is simple: if the metric rises with send volume, it is not measuring engagement.
It is useful as a tracked trend with verbatim comments attached, and misleading almost everywhere else. The score is sensitive to sampling, timing, question placement and cultural response patterns, and it moves for reasons unconnected to anything the business did. Treat the comments as the valuable output and the number as a rough index rather than a target.
Because satisfaction only measures the interactions people chose to have and respond about, and disengaging customers stop interacting first. As a base quietly drifts away, surveys come from fewer, more committed people, so the average can hold or rise while the business shrinks. This is why satisfaction should never be the headline health metric.
A measure of how much work the customer had to do to get something done, asked immediately after a specific interaction. It matters because effort predicts churn more reliably than satisfaction: customers rarely leave because they were insufficiently delighted, but they leave regularly because something was difficult, repeated or required too many contacts to resolve.
Asking too late, when memory has decayed and the answer becomes about the brand generally. Asking too much, which selects for the unrepresentative minority with time. Leading questions. Averaging scores across completely different contexts. Incentivising the score, which corrupts it within one review cycle. Ignoring non-responders, who are disproportionately about to leave. And omitting a free-text box.
One north-star metric defined from your own churn data, supported by three metrics covering different failure modes: one revenue, one depth, one sentiment or effort. Behaviour instrumented before opinion, surveys designed to be acted on, a visibly closed feedback loop, audience-specific reporting from the same dataset, and an annual audit of how each metric could be gamed.