Key Takeaways
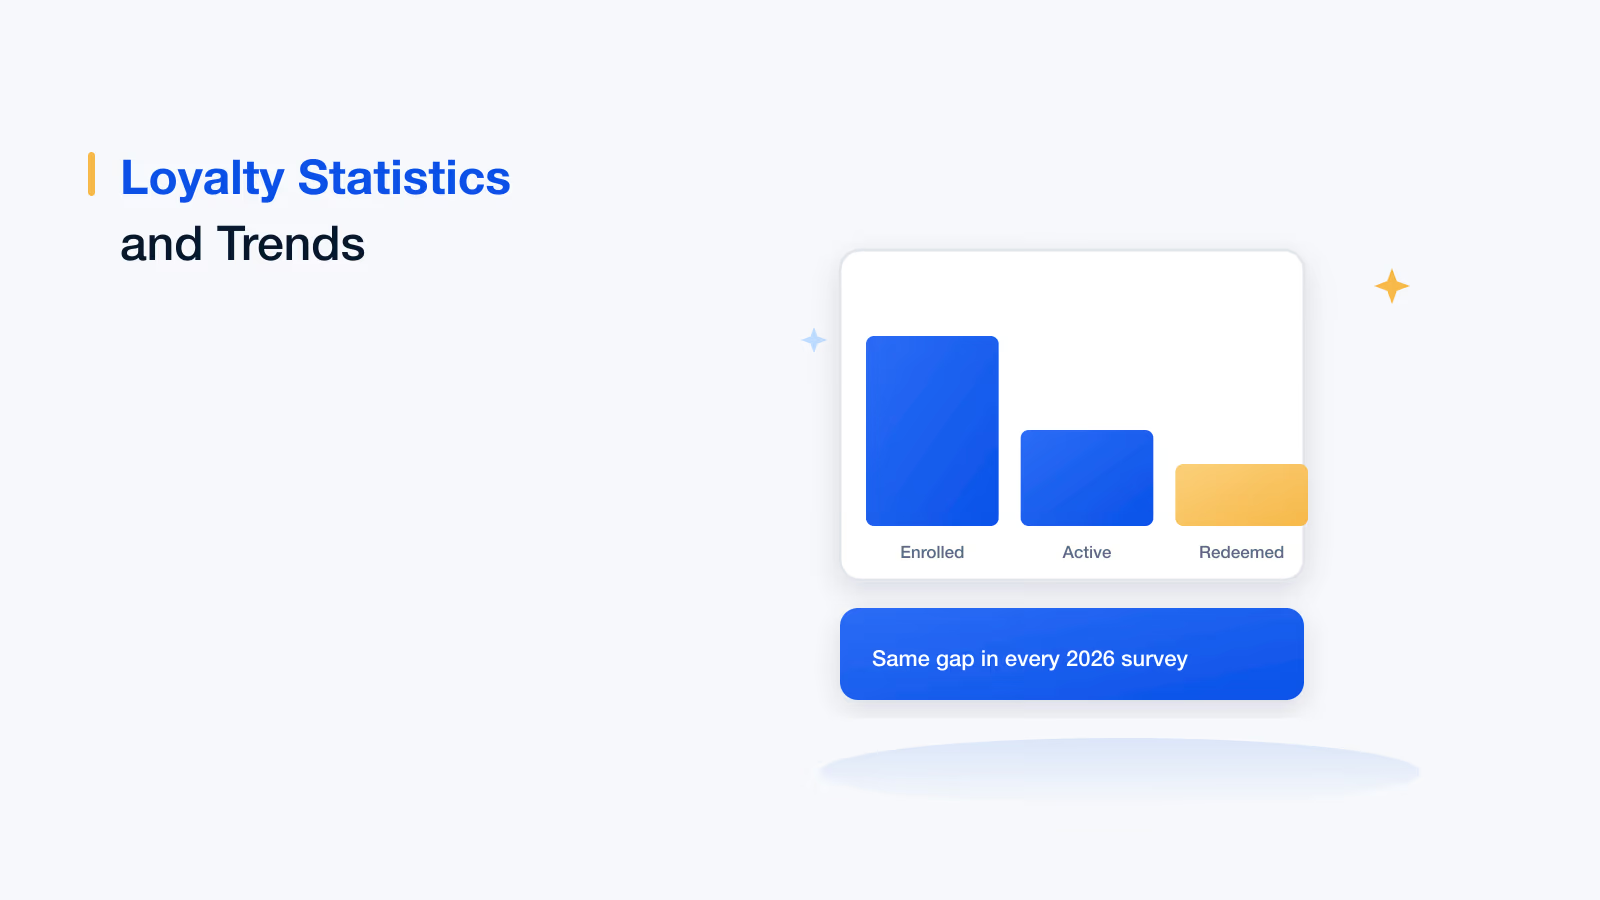
Enrolment and points issued are not measurement. A programme can grow membership every quarter while the people in it buy less often.
Track all six metric families. Emotional signals move before behaviour does, so transactional data alone reports the change too late.
Low redemption is not a saving. It signals rewards that are unattractive or unreachable, and the unredeemed balance is a growing liability.
Agree metric definitions in writing first. Most loyalty reporting disputes are two teams calculating retention differently.
Replace enrolment with active member rate in headline reporting, and put redemption beside it.
Most loyalty programmes report on the wrong thing. Enrolment numbers, points issued, emails opened: all easy to produce, none of them evidence that the programme changed behaviour. A programme can grow its membership every quarter while the people in it buy less often than they used to.
Loyalty analytics is the discipline of telling those apart. It answers three questions a dashboard of totals cannot: who is actually loyal, what is driving it, and which members are quietly on the way out.
This guide covers the metrics worth tracking, how to structure the data behind them, and the measurement traps that make loyalty reporting look better than the programme is. For the programme mechanics these metrics measure, see our guide to types of loyalty programs.
Why totals are not measurement
Three failures recur in loyalty reporting, and all of them look like success on a slide.
- Enrolment counted as engagement: Members who joined for the sign-up bonus and never returned still appear in the headline number for years.
- Points issued counted as value: Issuance is a liability. Until points are redeemed, you have recorded a cost and delivered no experience.
- Averages hiding the distribution: A stable average spend can conceal your best members declining while new sign-ups mask it.
The fix is not more dashboards. It is measuring at the member level, over time, against a baseline.
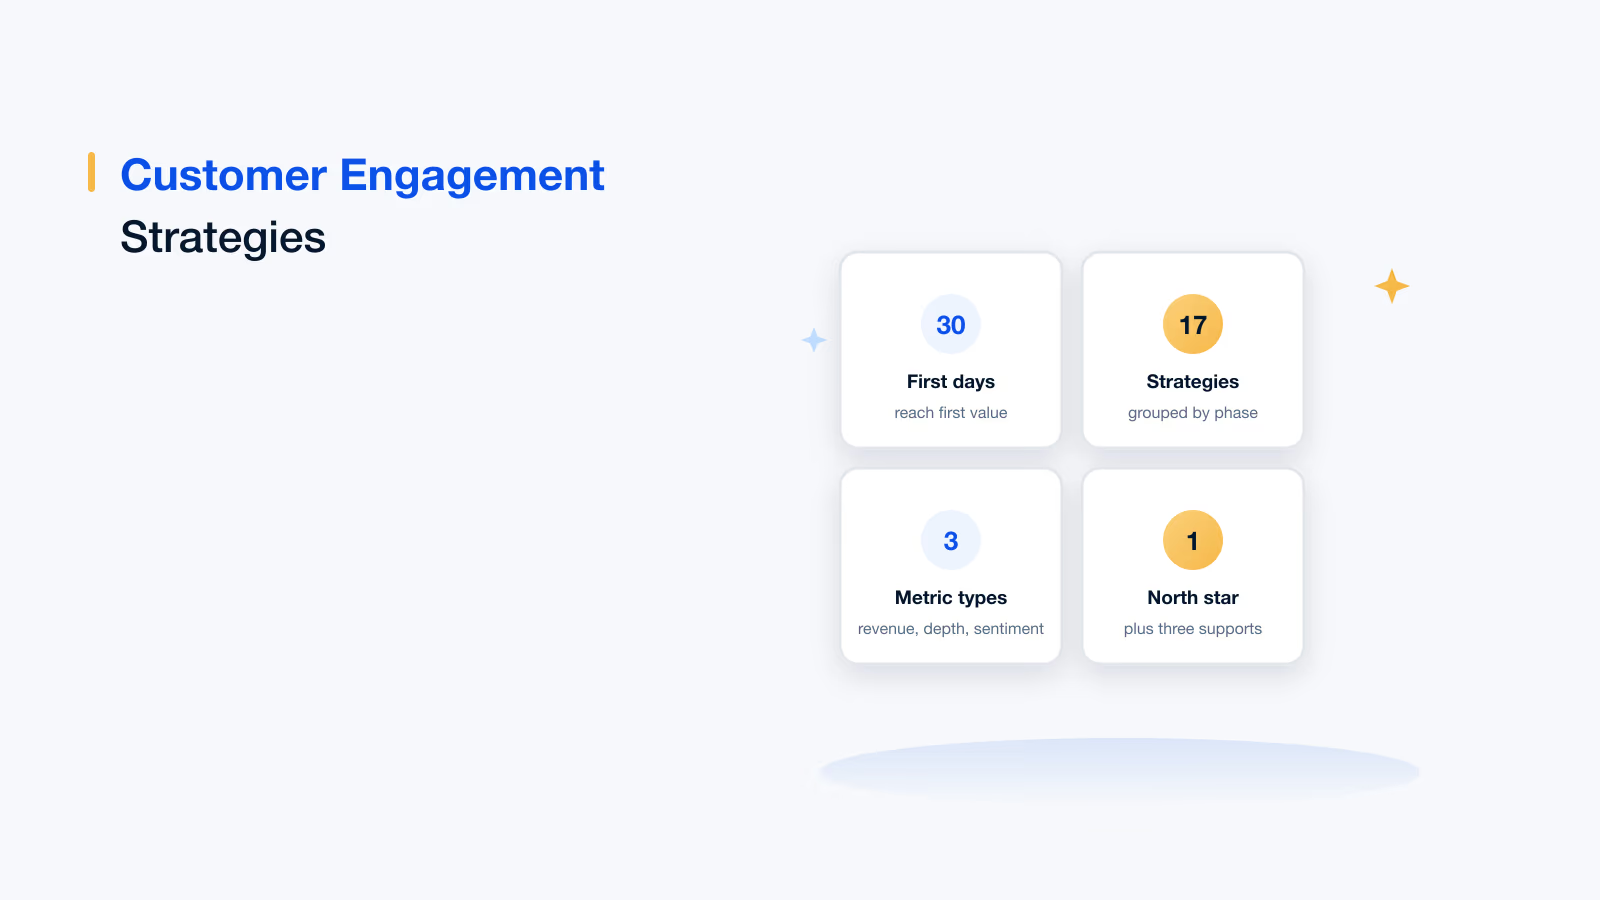
6
Metric families
emotional to advocacy
4
Steps to get there
collect, organise, analyse, act
1
Number that matters most
redemption, not issuance
Measure the programme, not the mailing list
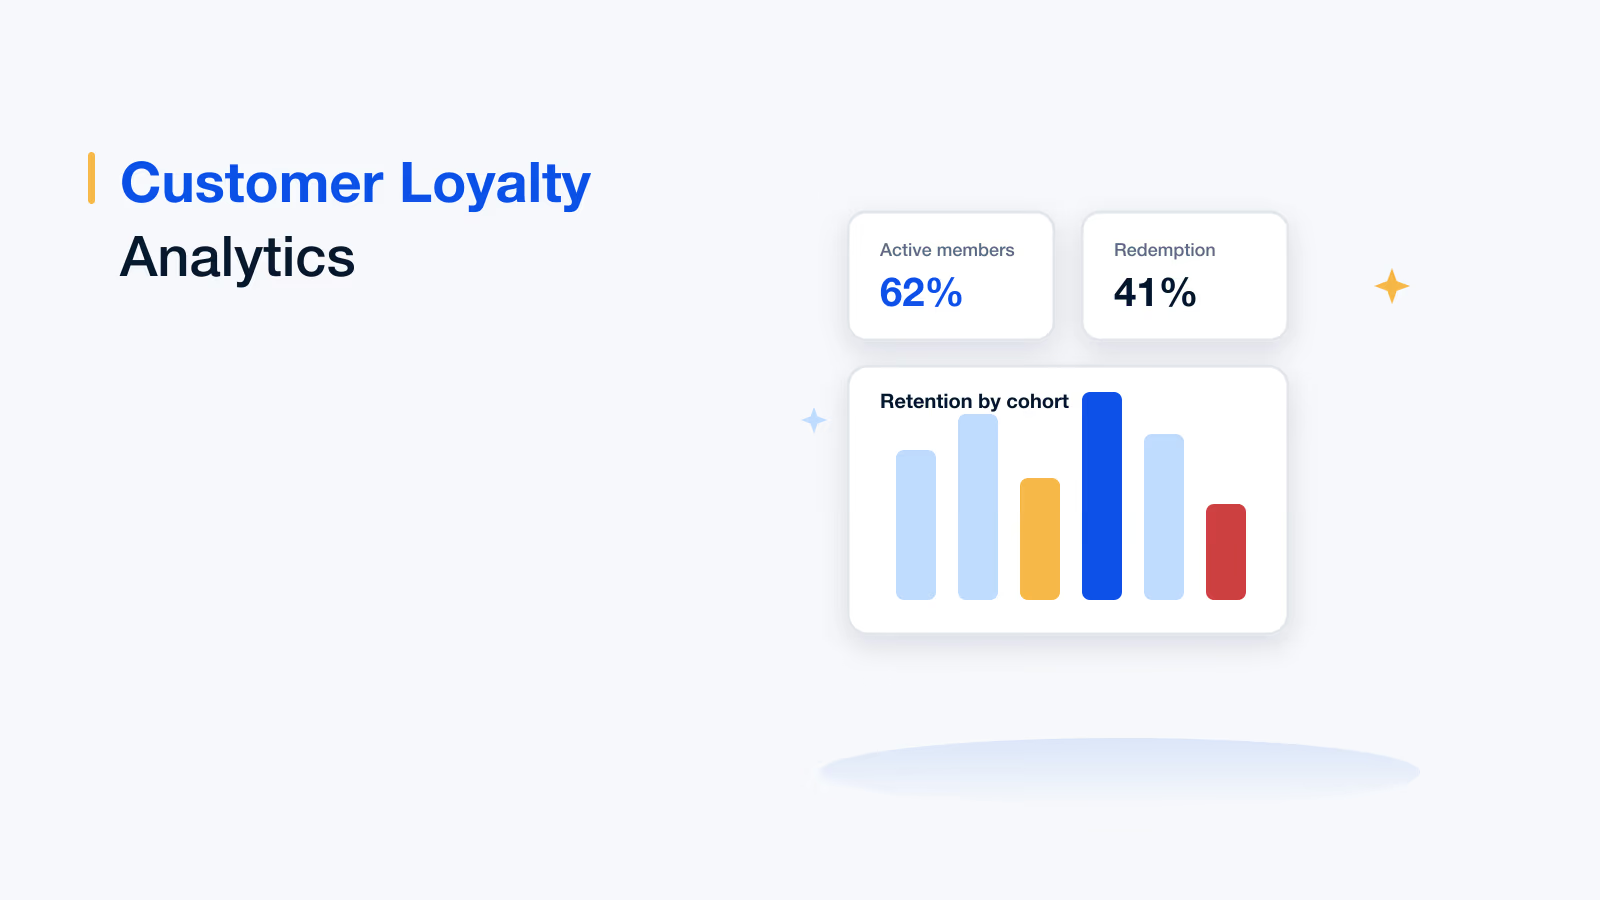
Retention, redemption and active member rate by cohort and segment, with churn scoring on top.
Book a demoTrusted by 5,000+ companies
The six families of loyalty metrics
Each family answers a different question. Tracking one family alone is how programmes end up confidently wrong.
1. Emotional loyalty
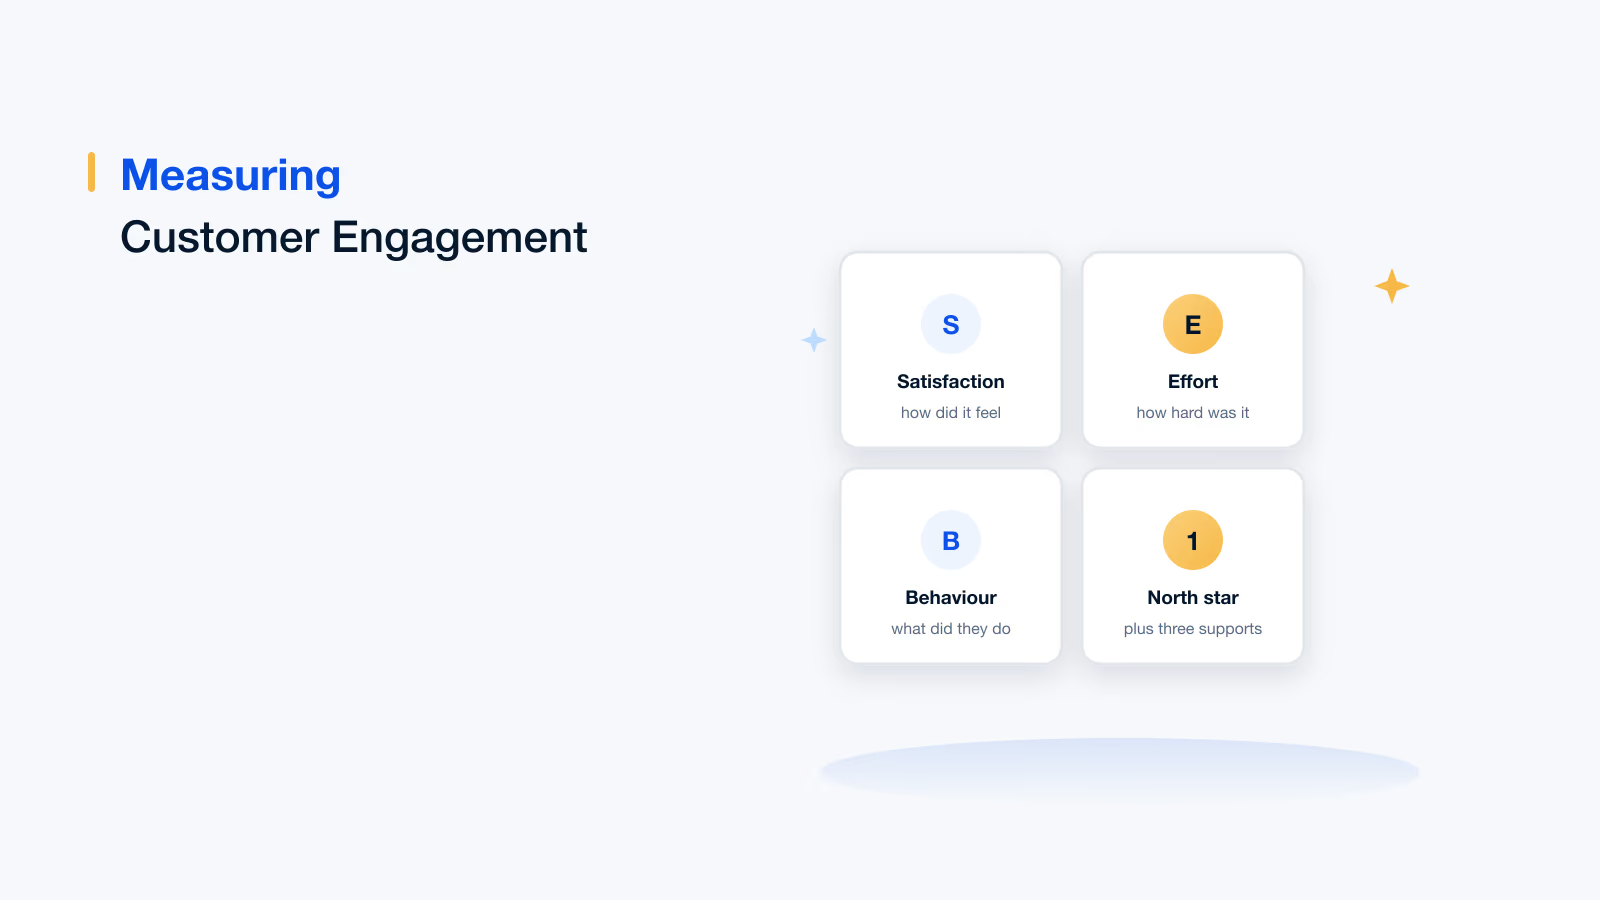
How the member feels, which predicts behaviour before behaviour changes.
- Net Promoter Score (NPS): Likelihood to recommend, scored 0 to 10 and split into detractors, passives and promoters. Useful as a trend, misleading as a single figure.
- Customer Satisfaction (CSAT): Satisfaction with a specific interaction. Narrow by design, which makes it good for diagnosing a particular touchpoint.
- Customer Effort Score (CES): How hard the member had to work. Often the strongest predictor of churn, because effort is remembered longer than delight.
2. Behavioural loyalty
What the member does, independent of what they say.
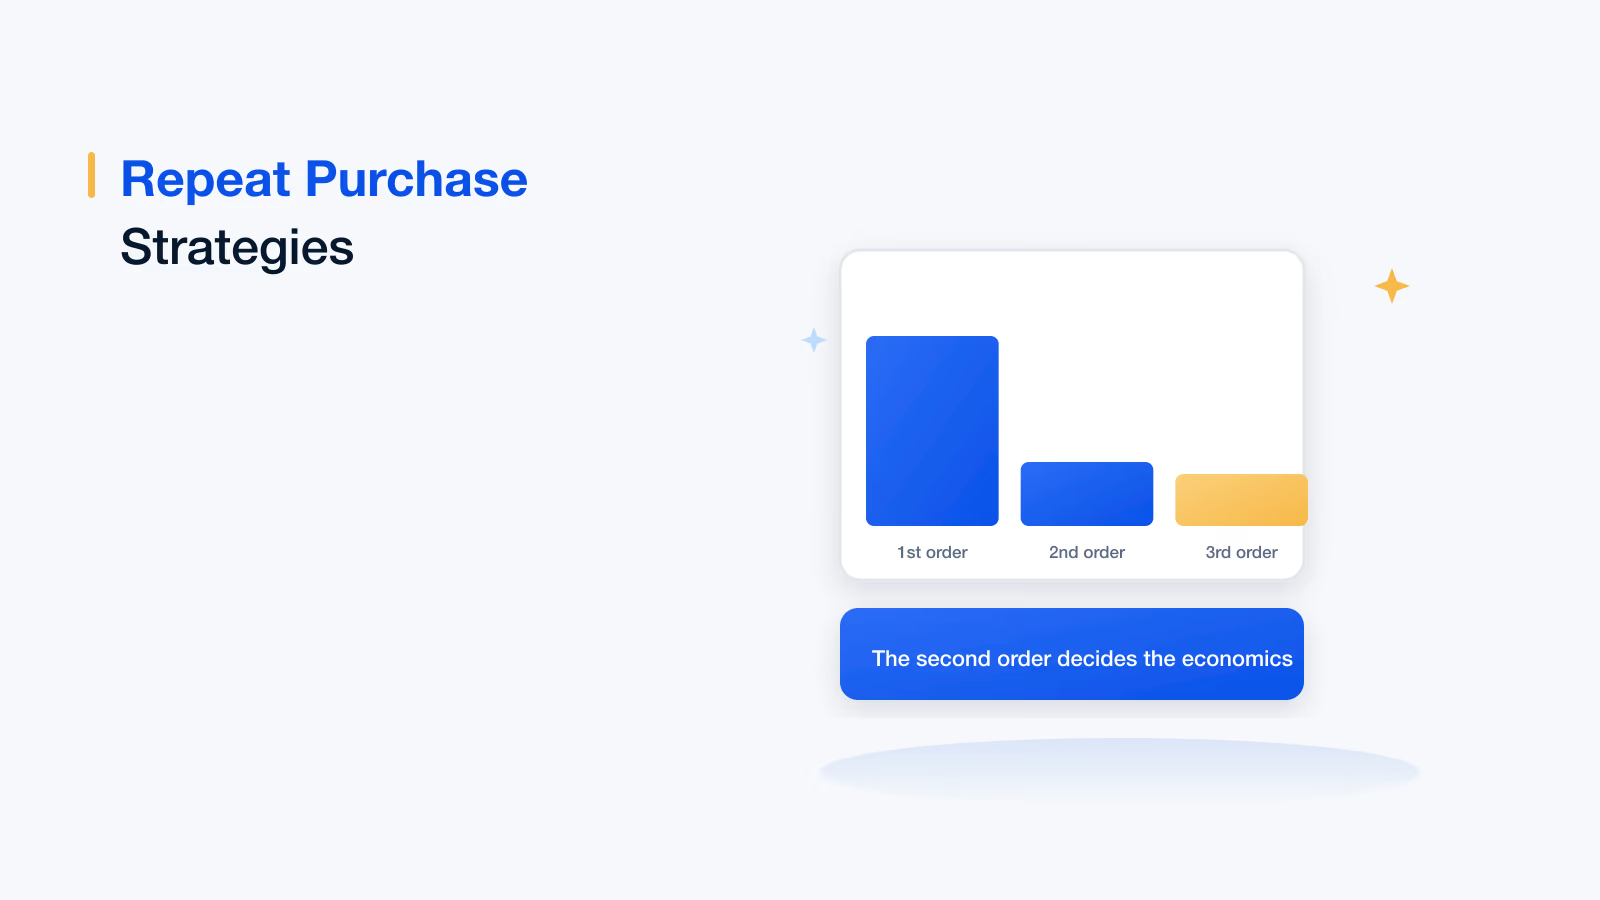
- Repeat purchase rate: The share of customers buying more than once in a period. The most honest single indicator of whether the proposition works.
- Purchase frequency: How often, tracked per member rather than as an average, so declines surface before they reach the mean.
- Engagement rate: Interaction outside purchase, such as opens, visits and app sessions. An early-warning signal, not a goal in itself.
- Referral rate: New customers arriving through existing ones. Hard to game and strongly correlated with genuine satisfaction.
3. Transactional loyalty
- Customer lifetime value (CLV): Expected total revenue from the relationship. The number that should decide where retention budget goes.
- Average order value (AOV): Spend per transaction, useful for spotting whether loyalty is deepening or just repeating.
- Upsell and cross-sell rate: Whether members trust your recommendations enough to widen their spend.
4. Retention and churn
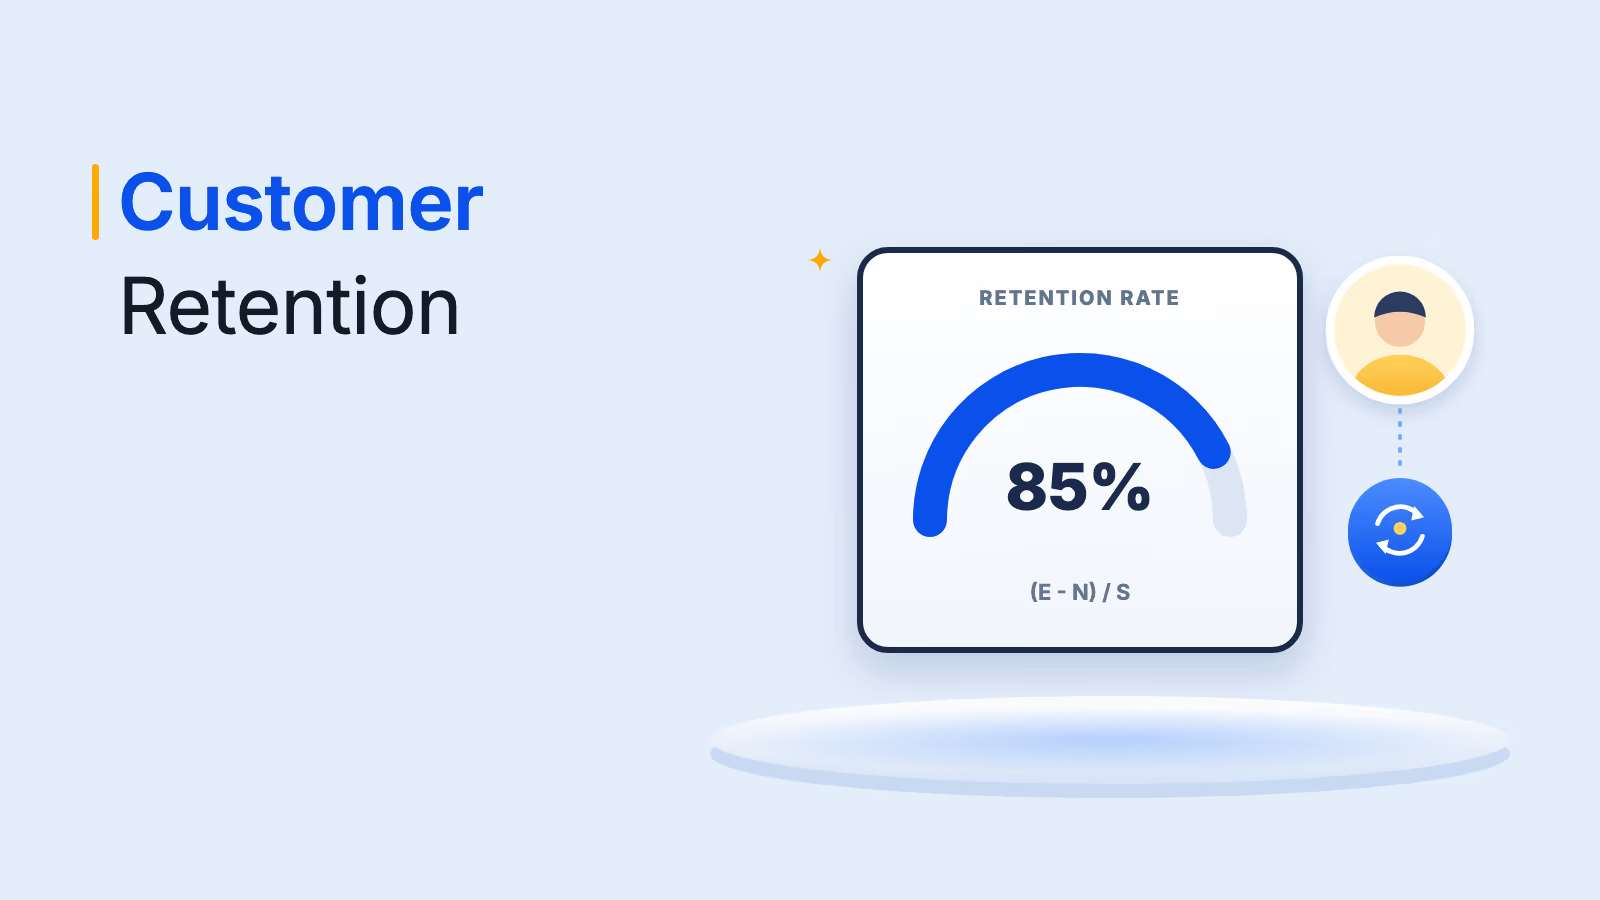
- Retention rate: The share still active at the end of a period. Define 'active' precisely or the number means nothing.
- Churn rate: The inverse, and more useful when segmented by cohort and tenure than reported whole.
- Reactivation rate: Dormant members who returned. The honest test of whether win-back campaigns do anything.
5. Programme-specific metrics
These are the ones most programmes under-report, and they are the ones that reveal whether the programme itself is working.
- Redemption rate: The share of issued points actually redeemed. Low redemption is not a saving, it is a sign the rewards are unattractive or unreachable, and it carries a growing liability.
- Active member rate: Members engaging consistently rather than ever. The number that should replace enrolment in your headline reporting.
- Programme engagement rate: Participation in programme mechanics specifically, separate from general brand engagement.
6. Advocacy
- Reviews and ratings: Direct, public and comparable over time.
- Social mentions and shares: Reach and sentiment, best read as a trend rather than a count.
- Referral contributions: Customers actually acquired through members, which converts advocacy into a revenue figure.
The measurements worth defining precisely
Most loyalty reporting disputes come from two teams calculating the same metric differently. Agree these in writing before the first report.
| Metric | How it is calculated | The definition that trips people up |
|---|---|---|
| Retention rate | Members active at period end who were active at start, divided by those active at start | What counts as 'active', and whether new joiners are excluded |
| Repeat purchase rate | Customers with 2+ purchases in the period, divided by all purchasing customers | Whether the window is fixed or rolling per customer |
| Redemption rate | Points redeemed in a period divided by points issued in that period | Issuance and redemption rarely fall in the same period, so cohort it |
| Active member rate | Members meeting an activity threshold, divided by total enrolled | The threshold itself, which should be defensible not convenient |
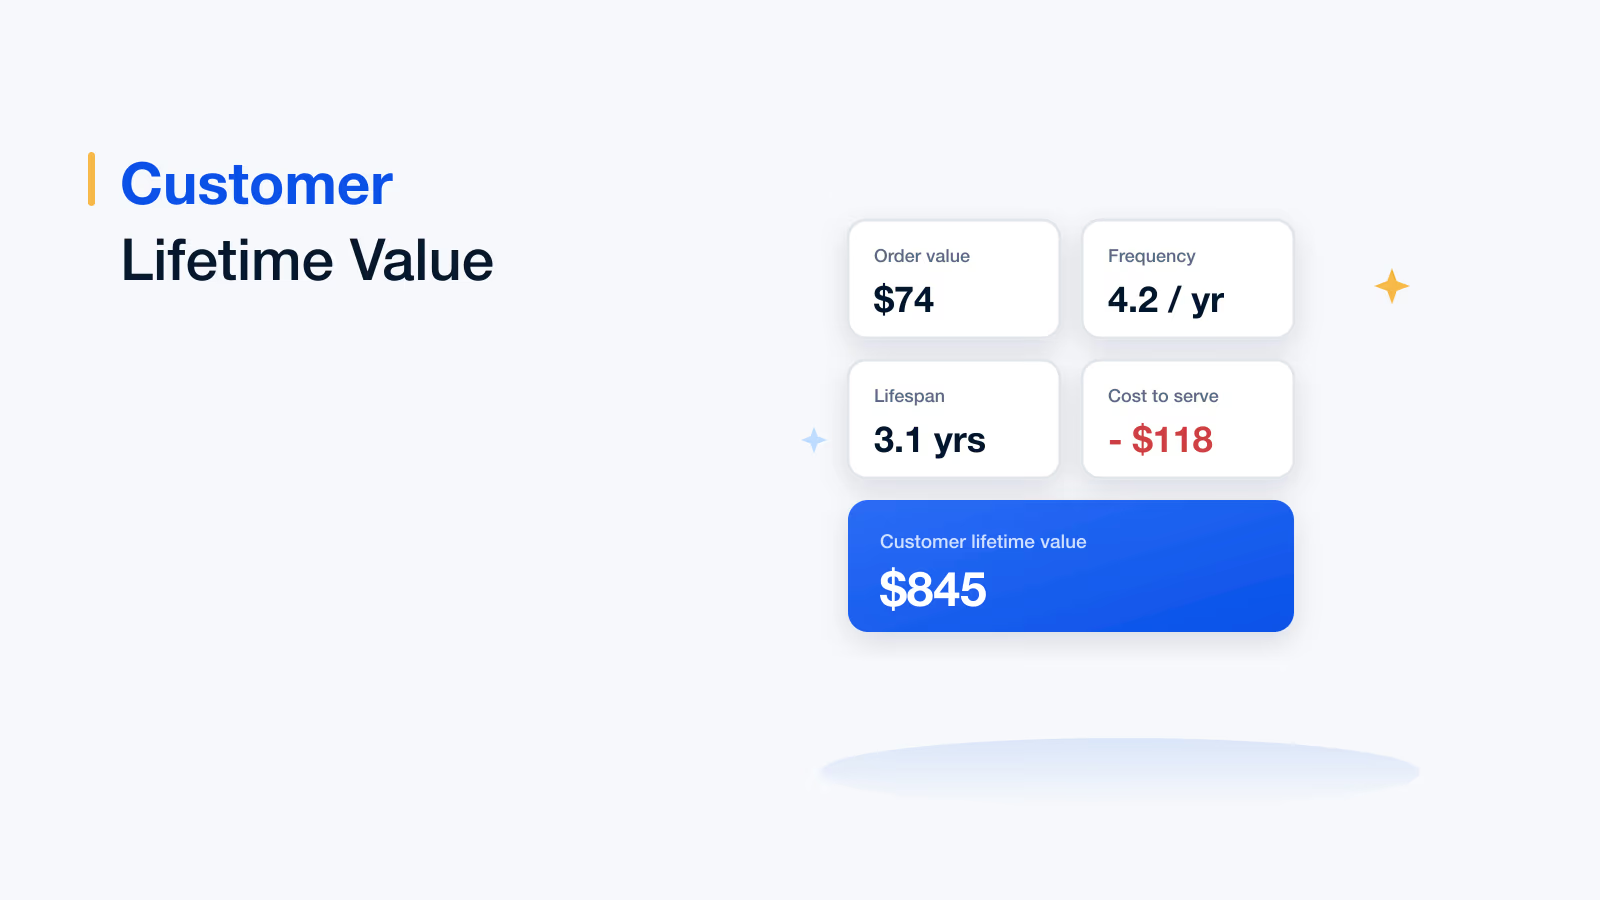
| CLV | Average order value x purchase frequency x expected lifespan, less cost to serve | Whether cost to serve is included; most published CLVs quietly omit it |
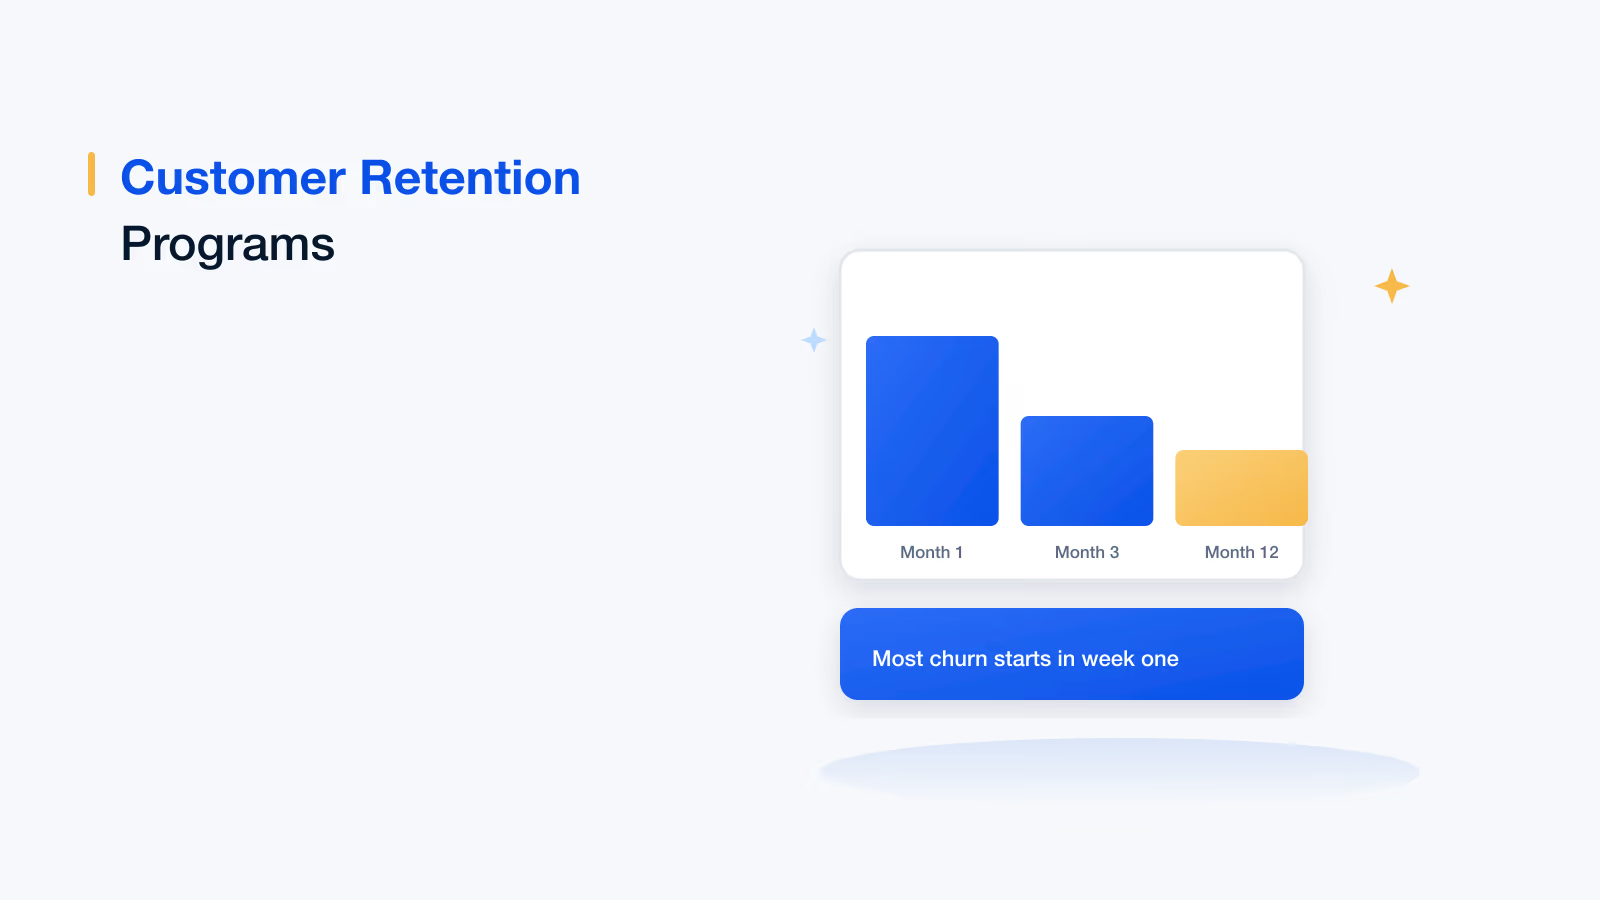
| Churn rate | Members lost in a period divided by members at the start | Tenure cohorts, since month-one churn and year-three churn are different problems |
Building the data behind the metrics
- Collect at the event level: Transactions, programme events, service contacts and survey responses, each with a consistent member identifier. Aggregates cannot be disaggregated later.
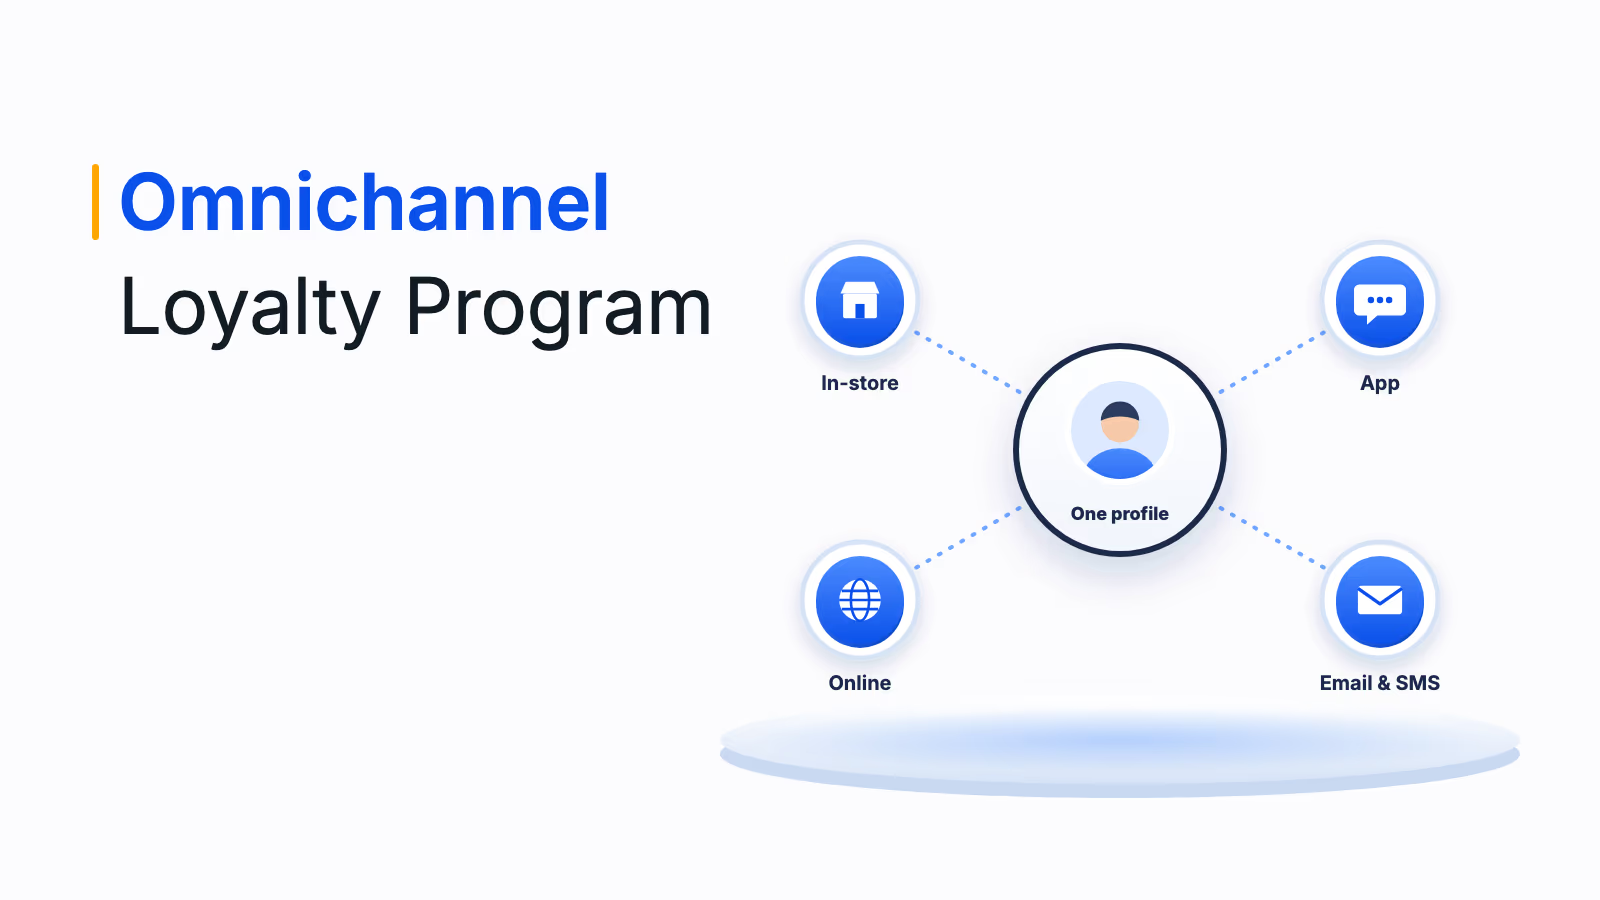
- Resolve identity across channels: One member, one record, whether they bought in store, in app or online. Programmes that skip this consistently misread their multichannel members as several occasional ones.
- Organise for analysis, not storage: A member-level table with behaviour over time, not a warehouse that requires a bespoke query for every question.
- Analyse against a baseline: Segment, cohort and compare. A number with nothing to compare it to is a decoration.
- Close the loop: Feed the finding into a programme change, then measure the same metric again. Analytics that never changes anything is reporting.
Six ways loyalty analytics goes wrong
Each of these produces a number that looks defensible and is not. They are common enough that most loyalty reporting contains at least two of them.
1. Measuring only what is easy
Transactional data is clean and available, so programmes over-index on it and miss the emotional signals that move first. By the time spend drops, sentiment dropped months ago.
2. Confusing correlation with cause
Members who redeem more also spend more. That does not mean redemption caused the spending; your best customers were always going to do both. Without a control group you are describing, not explaining.
3. Letting data sit in silos
Ecommerce in one system, store in another, support in a third. Each tells a partial story, and the partial stories flatter the programme because nobody sees the member who buys less online because they switched to a competitor's app.
4. Tracking too many metrics
Thirty metrics on a dashboard means nobody is accountable for any of them. Pick the handful that would change a decision and report those; keep the rest for diagnosis.
5. Ignoring at-risk members
Reporting usually celebrates the top decile and ignores the members quietly declining. The declining group is where analytics pays, because that is the only group whose behaviour you can still change.
6. Never acting on the finding
The most common failure. The analysis is produced, circulated, agreed with, and nothing in the programme changes. Build the next action into the reporting cycle or the cycle is theatre.
What to automate
- Anomaly alerts: Sudden shifts in redemption, enrolment or engagement surfaced automatically rather than noticed at month end.
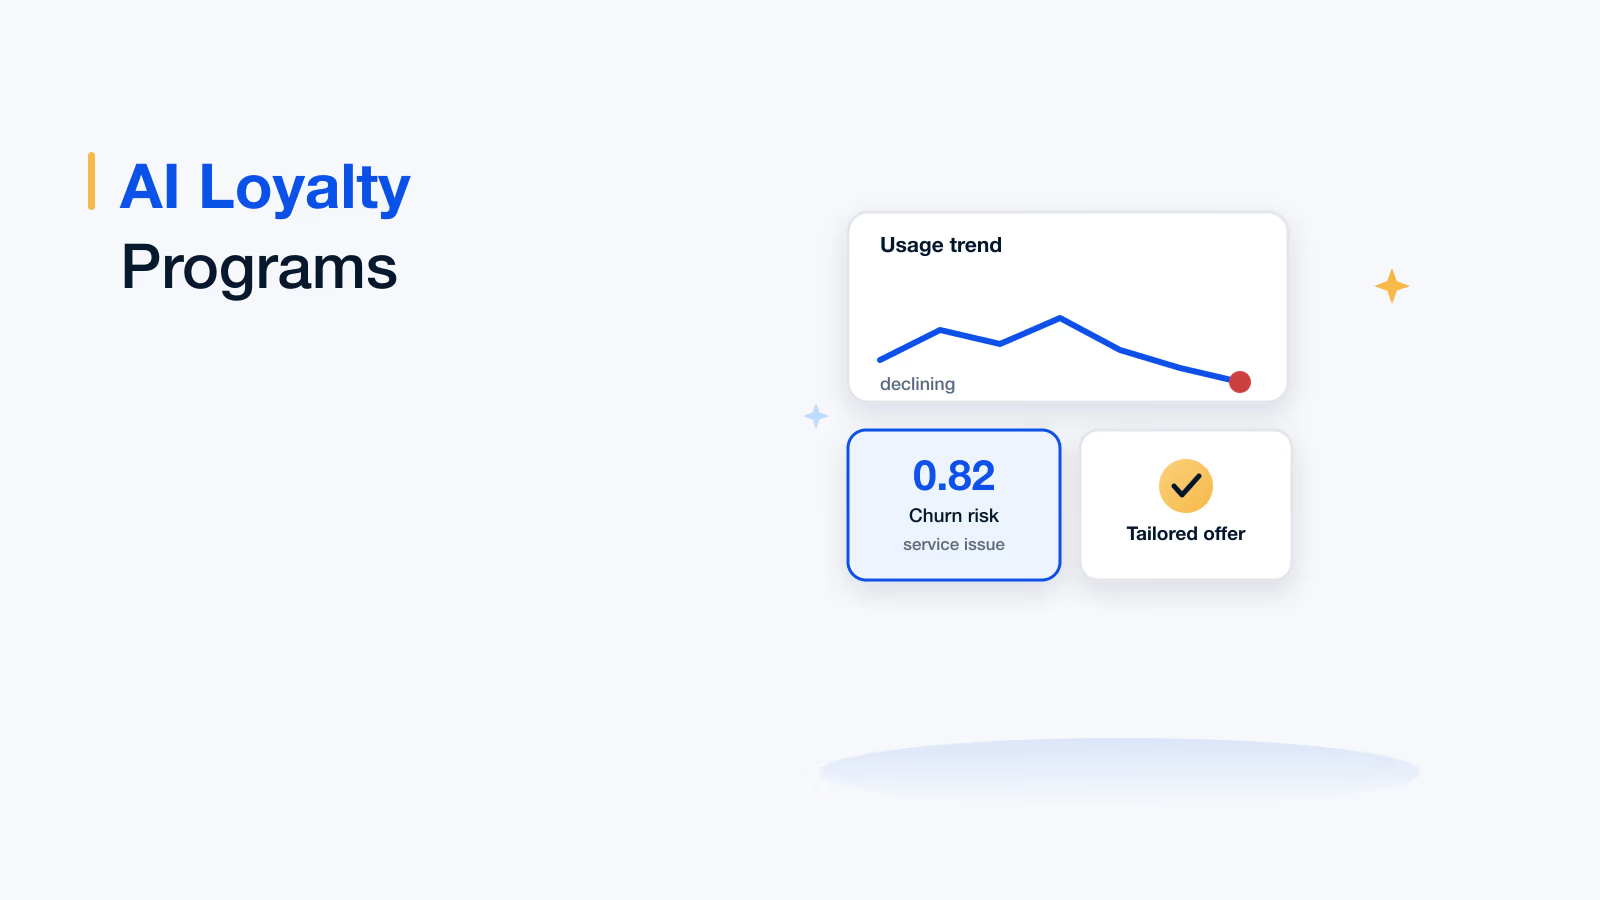
- Churn scoring: Per-member risk with reasons attached, refreshed continuously. Our guide to AI loyalty programs covers how this works.
- Cohort reporting: Retention and redemption by join month, generated rather than rebuilt by hand each quarter.
- Segment refresh: Behavioural segments that update as behaviour changes, not as the planning calendar dictates.
- Liability tracking: Outstanding points value per market, which is a finance number as much as a marketing one.
Loyalty analytics on Loyalife
01 · Collect
Event-level member data
Transactions, programme events and engagement captured against one member identity across every channel.
02 · Measure
The metrics that matter
Retention, redemption, active member rate and CLV reported per cohort and segment rather than as a single average.
03 · Segment
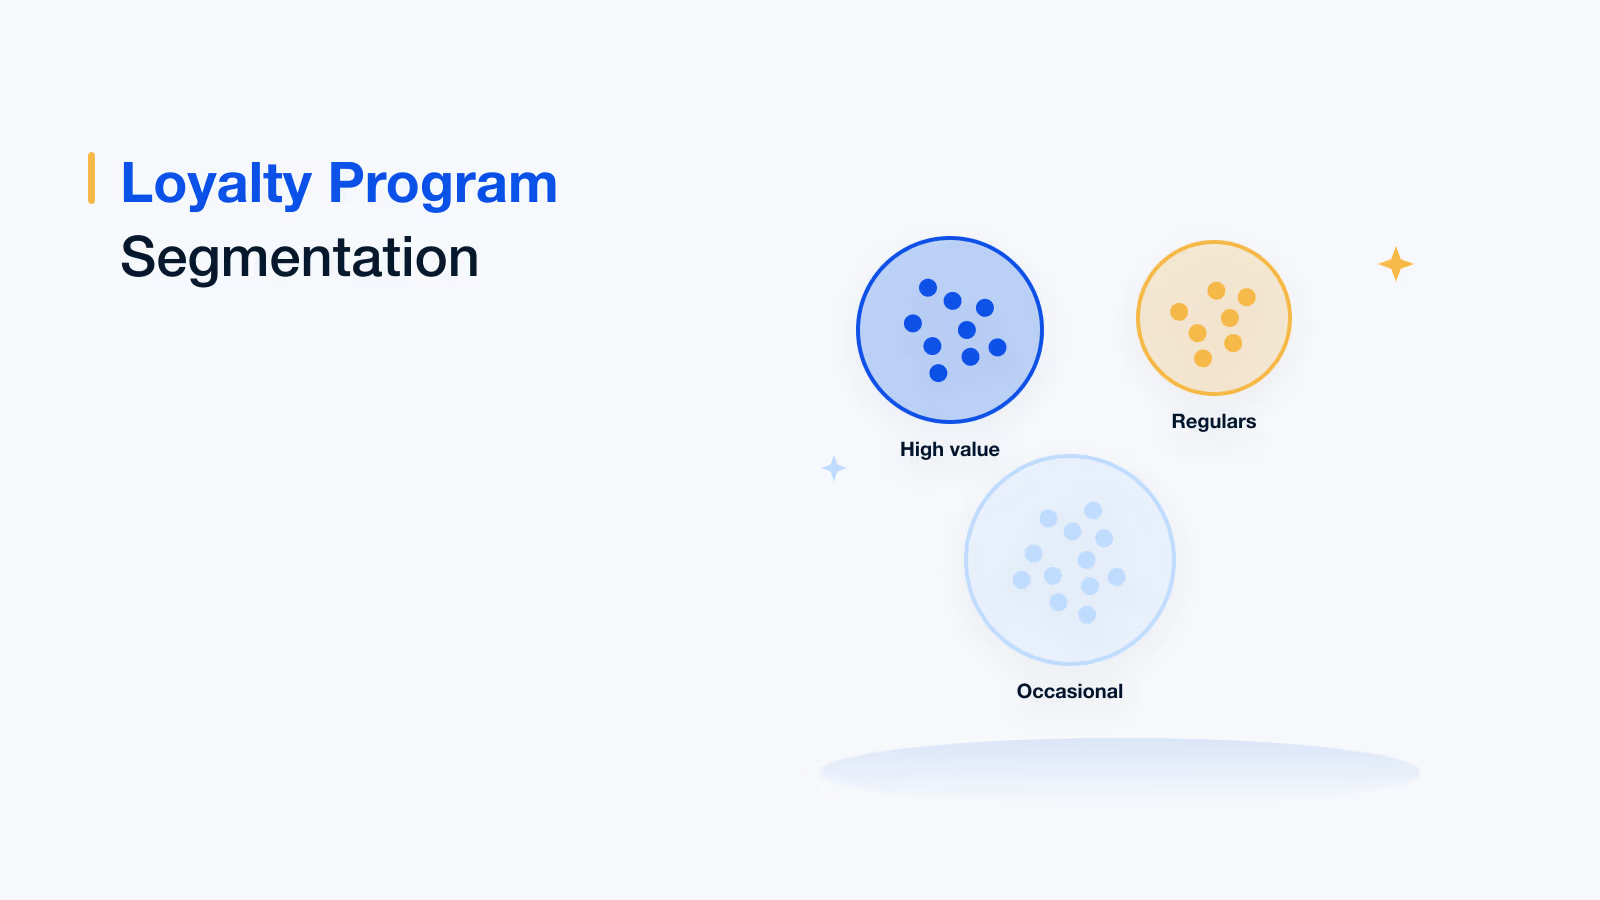
Behavioural segmentation
Segments built from what members actually do, refreshed continuously instead of quarterly.
04 · Predict
Churn and value scoring
Per-member risk with the drivers behind it, so the declining group is visible while there is still time.
05 · Control
Liability and redemption reporting
Outstanding points value tracked per market, which is what finance asks for and most programmes cannot produce.
06 · Act
Insight into campaign
Findings trigger programme rules and campaigns directly, so the loop between analysis and action actually closes.
You can also explore the Loyalife platform and member profile and segmentation.
If you change one thing: replace enrolment with active member rate in your headline reporting, and put redemption next to it. Those two numbers together tell you whether the programme is working, and almost no amount of membership growth can disguise it.
Book your Loyalife demo
Frequently asked questions
Customer loyalty analytics is the practice of measuring loyalty at the member level over time, rather than reporting programme totals. It answers three questions that a dashboard of enrolment and points issued cannot: who is genuinely loyal, what is driving that loyalty, and which members are quietly disengaging while the headline numbers still look healthy.
Six families, because each answers a different question. Emotional: NPS, CSAT, Customer Effort Score. Behavioural: repeat purchase rate, purchase frequency, engagement, referral rate. Transactional: CLV, average order value, upsell rate. Retention: retention, churn, reactivation. Programme-specific: redemption rate, active member rate. Advocacy: reviews, social mentions, referral contributions.
Points issued is a liability you have recorded without delivering an experience. Redemption is the moment the member receives value and the moment the liability clears. A low redemption rate is therefore not a saving: it usually means the rewards are unattractive or out of reach, and the unredeemed balance keeps growing on the balance sheet.
The common formula is average order value multiplied by purchase frequency multiplied by expected customer lifespan, less the cost to serve. The last term is where most published CLV figures quietly differ, because omitting cost to serve inflates the number. Agree whether it is included before the figure is used to set retention budget.
There is no universal benchmark worth quoting, because retention depends on purchase cycle, category and how you define active. A monthly grocery programme and an annual insurance renewal cannot be compared. The useful benchmark is your own trend, measured by tenure cohort, since month-one churn and year-three churn are different problems with different fixes.
Usually for one of six reasons: measuring only transactional data because it is easiest, mistaking correlation for cause without a control group, leaving data siloed across channels, tracking so many metrics that nobody owns any, ignoring at-risk members in favour of celebrating the top decile, and producing analysis that never changes the programme.
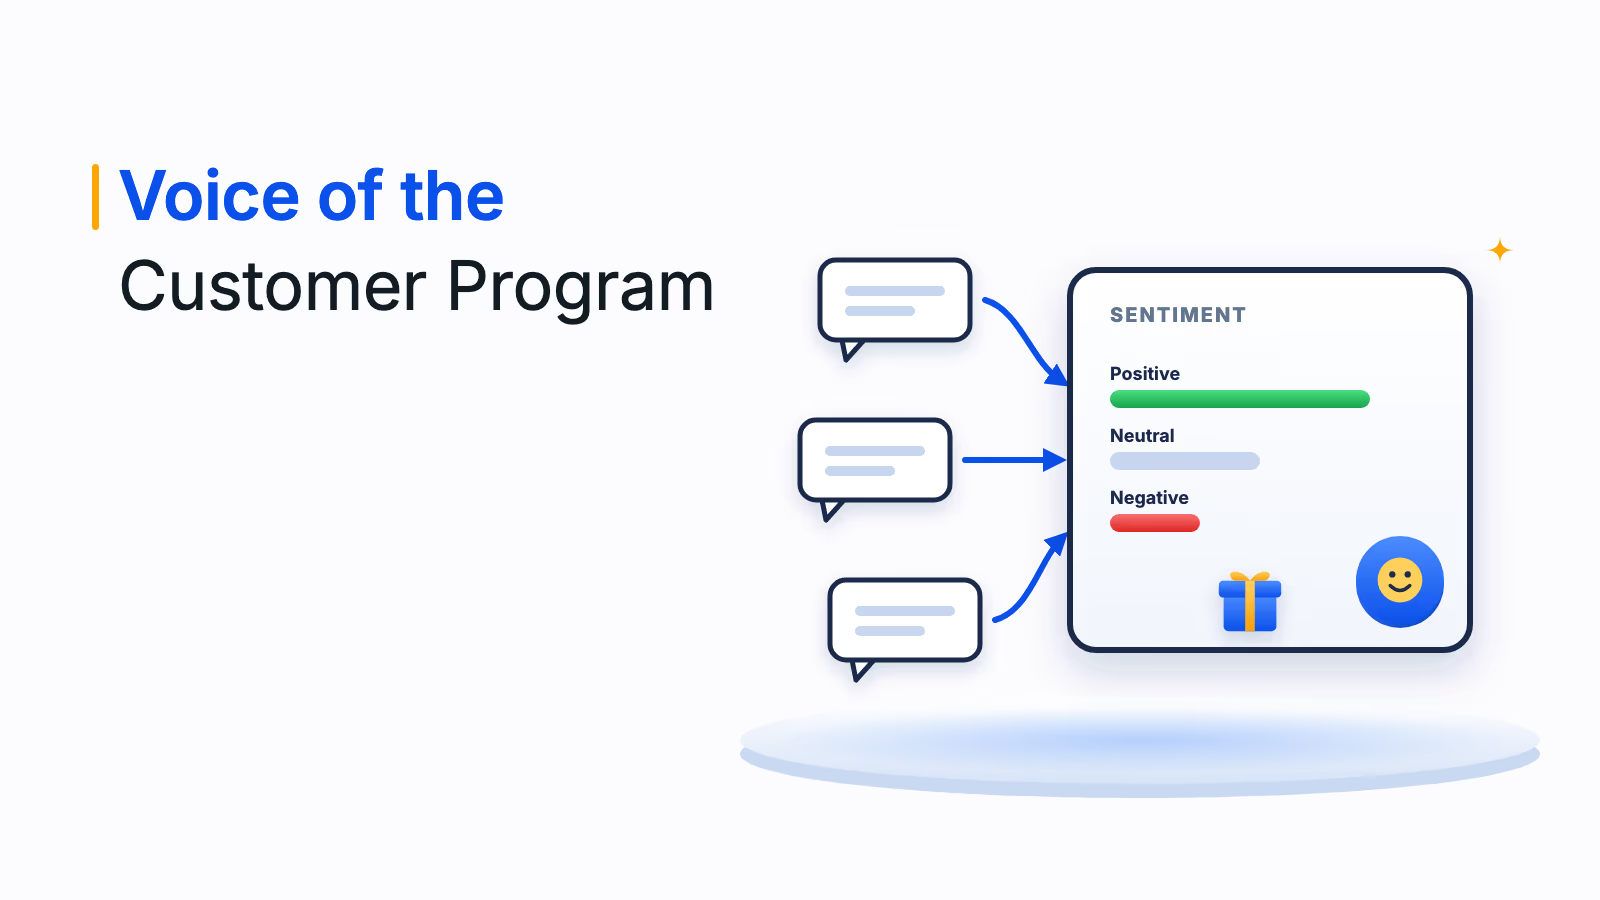
Through NPS, CSAT and Customer Effort Score, read as trends rather than single figures. Customer Effort Score is often the strongest churn predictor of the three, because members remember difficulty far longer than they remember delight. These signals tend to move before transactional behaviour does, which is what makes them worth collecting.
Event-level records rather than aggregates: transactions, programme events, service contacts and survey responses, each tagged with a consistent member identifier. Identity must resolve across channels so one person who shops in store and in app reads as one member. Aggregated data cannot be broken back down, so collect at the event level from the start.