Key Takeaways
Measuring employee experience means tracking how employees experience each stage of work and linking those metrics to business results.
Employee experience ROI equals total gains minus program cost, divided by program cost, times 100.
Gallup estimates replacing an employee costs about 40% of salary for frontline roles, 80% for technical roles and 200% for leaders.
A four-level framework of listening, experience, behavior and business metrics connects survey scores to financial outcomes.
The core employee experience metrics are eNPS, engagement, turnover and retention, productivity, wellbeing, career growth, feedback, tool adoption and customer outcomes.
Measuring employee experience means tracking how employees experience each stage of their work, with metrics such as eNPS, engagement, retention and wellbeing, and linking those numbers to business results like productivity, customer satisfaction and revenue. Done well, it tells you which initiatives work and lets you prove their ROI to leadership.
Ever seen the online threads about employees who deserved a raise, or at least an experience that made them feel valued, but got a kitschy gift instead? One company reportedly handed out a small sheet of bubble wrap in place of holiday pay, with a note telling staff to pop a stress-relieving capsule as needed. The common thread in all these stories is a bad experience, and most of those employees had already quit or were planning to.
Employers who fail to read the pulse of their workforce lose their best talent and suffer in business results. That is why it is important to:
- Understand the worth of your employee experience initiatives
- Calculate the dividends of each program
- Quantify the return on your investment
This guide covers why measurement matters, a simple measurement framework, how to calculate employee experience ROI and the key employee experience metrics to track. For the basics, start with what employee experience is.
Why measuring employee experience matters
Companies that focus on employee experience tend to see greater improvement in business performance, but only measurement shows whether a specific initiative is helping. Without data, experience programs are the first budget line cut in a downturn.
The stakes are high. Gallup's State of the Global Workplace 2026 reports that only 20% of employees worldwide were engaged in 2025, and that low engagement cost the global economy about $10 trillion in lost productivity, roughly 9% of global GDP. Measurement also changes the experience itself: the Qualtrics 2026 Employee Experience Trends research found engagement was twice as high at employers that increased listening over the past year.
Since calculations need data, a good starting point is a platform that captures employee feedback, participation and outcomes in one place, so you can connect individual and team results to overall business performance.
An employee experience measurement framework
A practical employee experience measurement framework works in four levels, from what employees say to what the business earns. Each level answers a different question, and you need all four to prove ROI:
| Level | Question it answers | Example employee experience metrics |
|---|---|---|
| 1. Listening | Are employees telling us how they feel? | Survey participation, comment volume, feedback sessions held |
| 2. Experience | How do employees rate their experience? | eNPS, engagement score, lifecycle survey scores, wellbeing scores |
| 3. Behavior | Are employees acting differently? | Absenteeism, internal mobility, training participation, regretted turnover |
| 4. Business | Is the business better off? | Revenue per employee, customer satisfaction, cost of turnover, productivity |
Start with levels one and two, which you can measure within weeks. Levels three and four take a quarter or more to move, so set baselines early and compare like-for-like periods.
How to calculate employee experience ROI
Employee experience ROI compares the financial gains from an initiative with what it cost. The core formula, sometimes called return on experience (ROX), is simple:
Employee experience ROI (%) = (Total gains from the initiative − Cost of the initiative) ÷ Cost of the initiative × 100
Say you spend $45,000 a year on a recognition and feedback program. Over the year, lower turnover saves $50,000 in replacement costs and productivity gains are worth $65,000. Total gains are $115,000, so ROI = ($115,000 − $45,000) ÷ $45,000 × 100 = 155.6%. Put another way, every $1 invested returned about $2.56 in gains.
Turnover savings are usually the easiest gain to calculate, because replacement costs are well documented. Gallup's 2024 research on preventable turnover estimates these costs as a share of annual salary:
40%
Frontline employees
Cost to replace, share of salary
80%
Technical professionals
Cost to replace, share of salary
200%
Leaders and managers
Cost to replace, share of salary
Source: Gallup, 2024
For example, if a 200-person frontline team with an average salary of $40,000 cuts annual turnover from 30% to 25%, that is 10 fewer exits. At 40% of salary, each exit costs $16,000, so the saving is $160,000 a year.
While the formula gives you a tangible number, true employee experience ROI also includes intangible benefits such as morale, employer brand and long-term retention. A step-by-step approach moves from tangible to intangible sources:
1. Tangible returns
Tangible ROI comes from financial data you can validate, such as revenue growth, productivity, lower turnover costs, fewer sick days and, for listed companies, shareholder returns. Your platform or analytics tool should be able to combine these numbers, compare periods and forecast the effect of changes:
- Revenue and revenue per employee
- Turnover and hiring cost savings
- Absenteeism and overtime costs
- Shareholder returns
2. Intangible returns
Intangible ROI shows up in engagement scores, retention, leadership approval and your position on best-workplace lists. These are harder to price but are often the earliest signs that an initiative is working:
- Employee engagement scores across the lifecycle, from onboarding to exit
- Annual turnover and retention rates
- Approval ratings for the CEO and leadership on review sites
- Position on best workplace or best employer lists
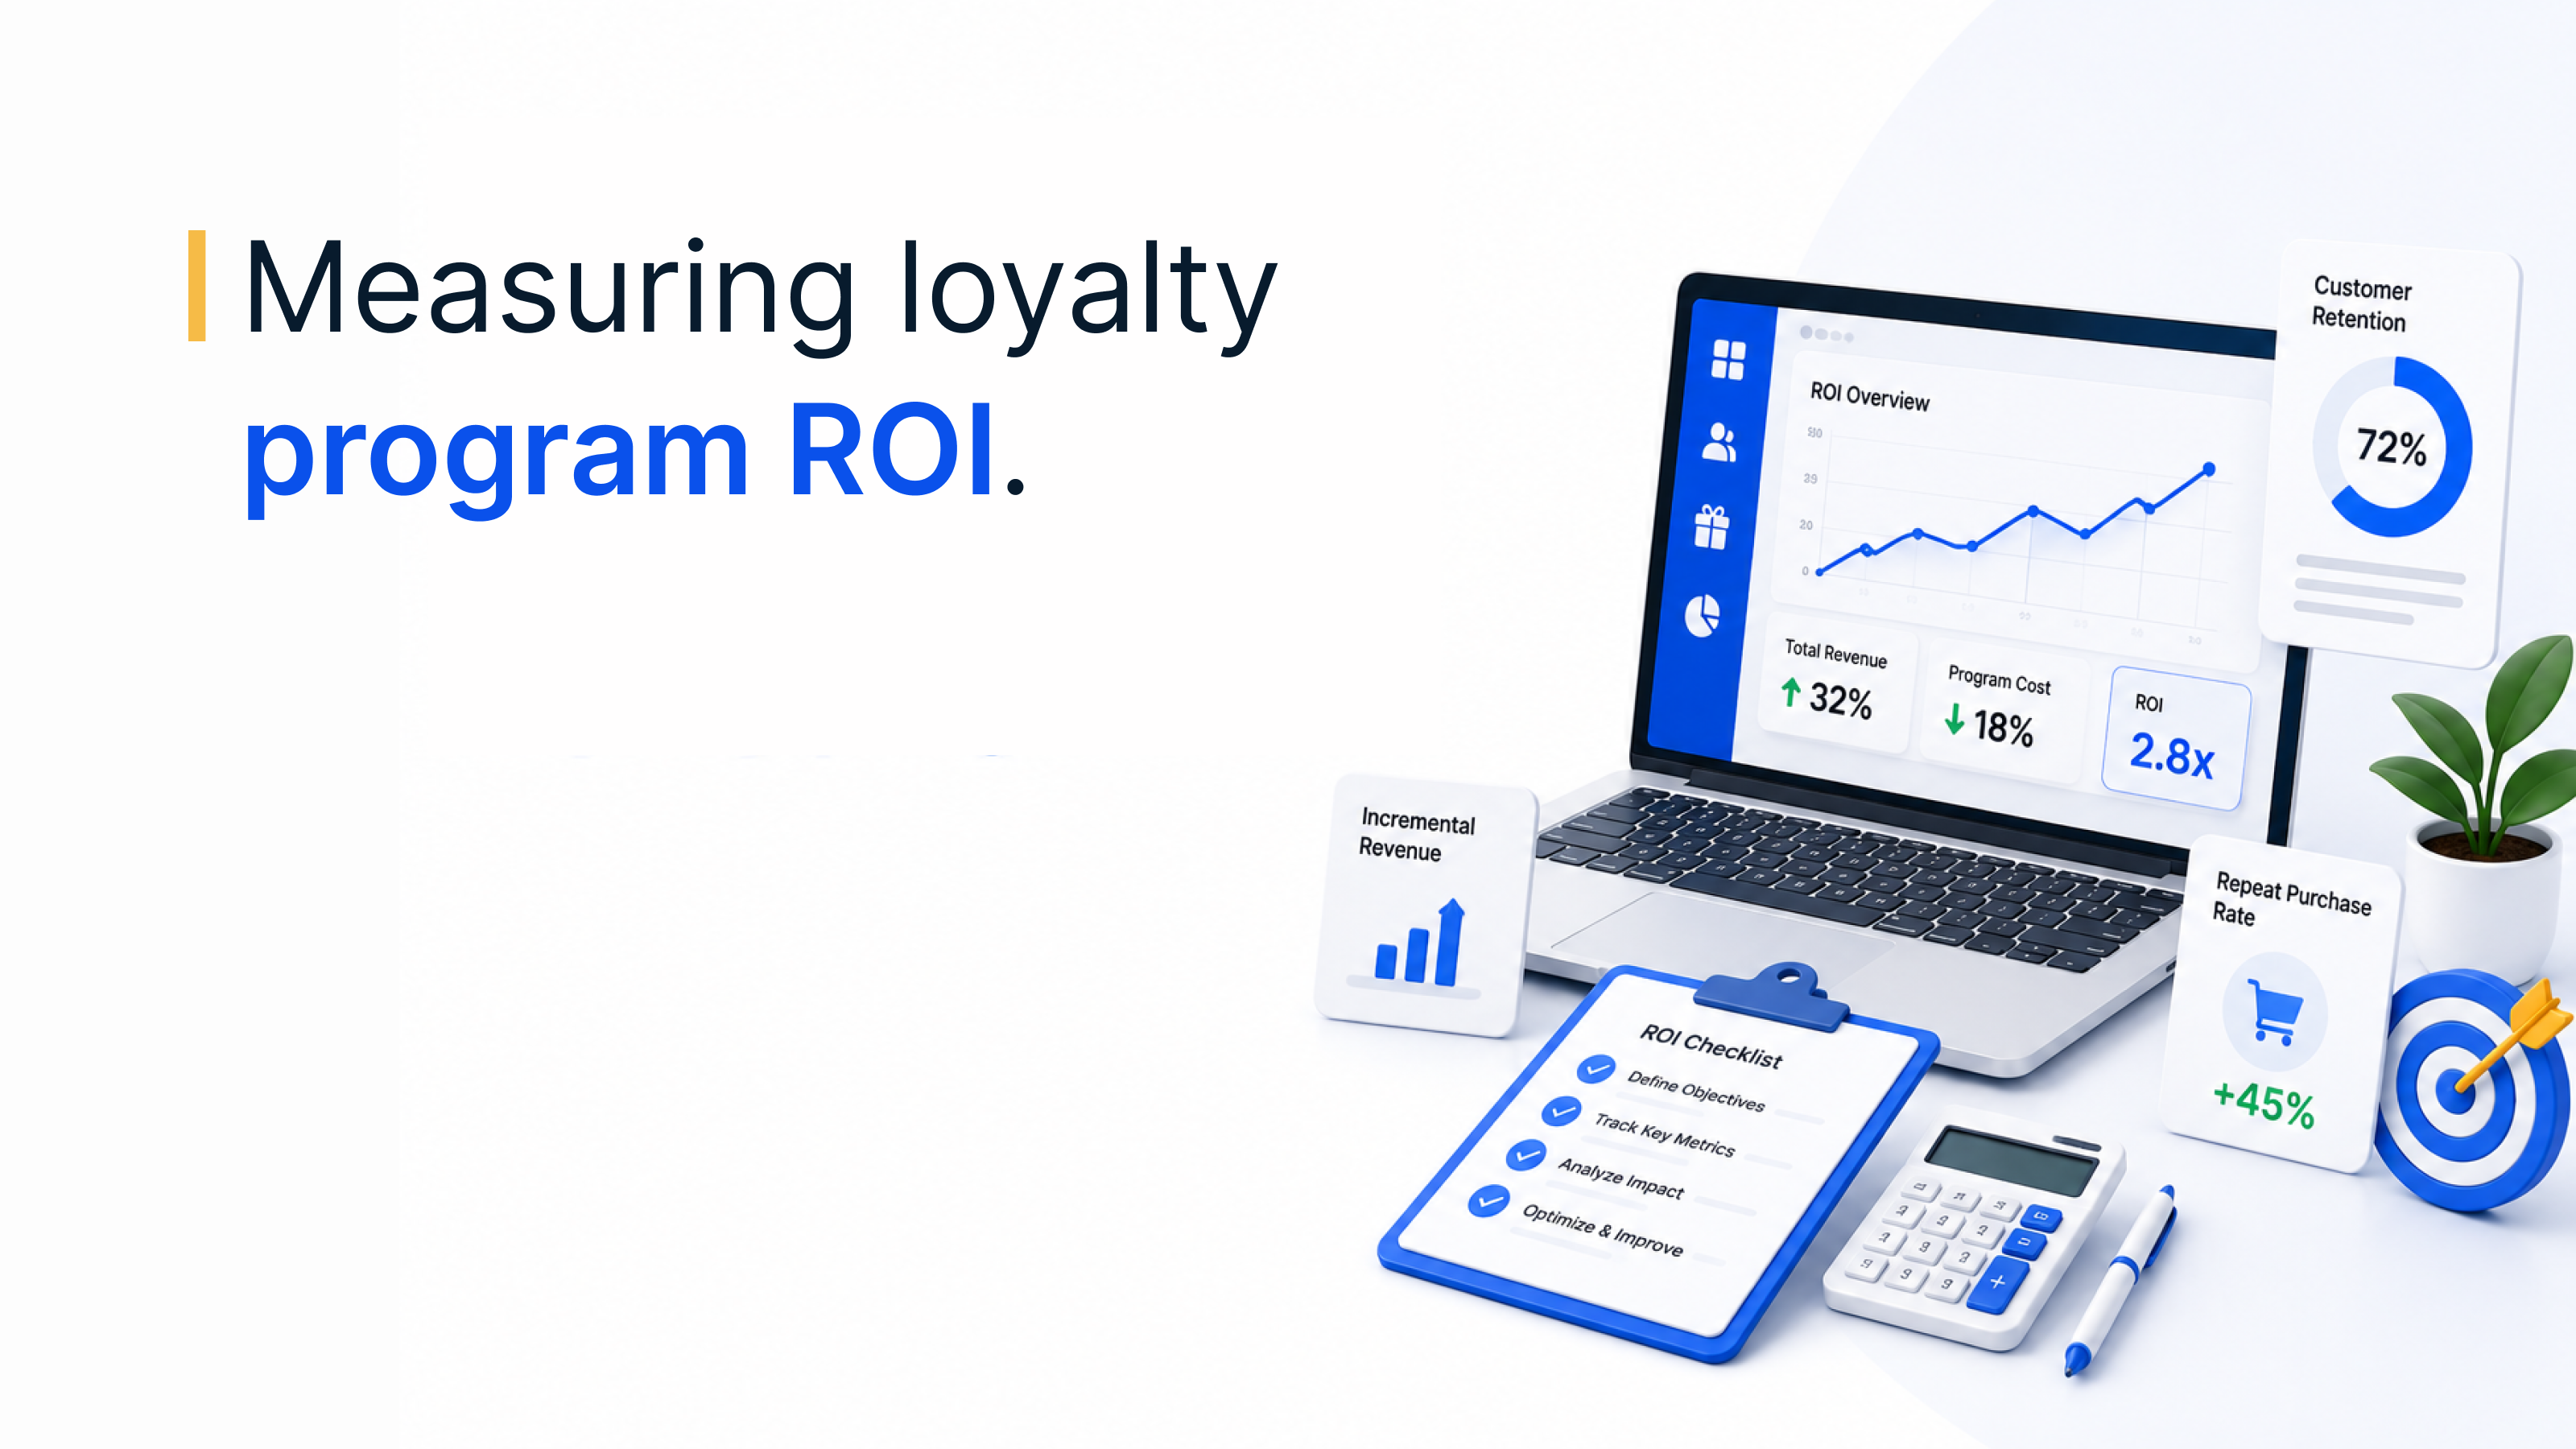
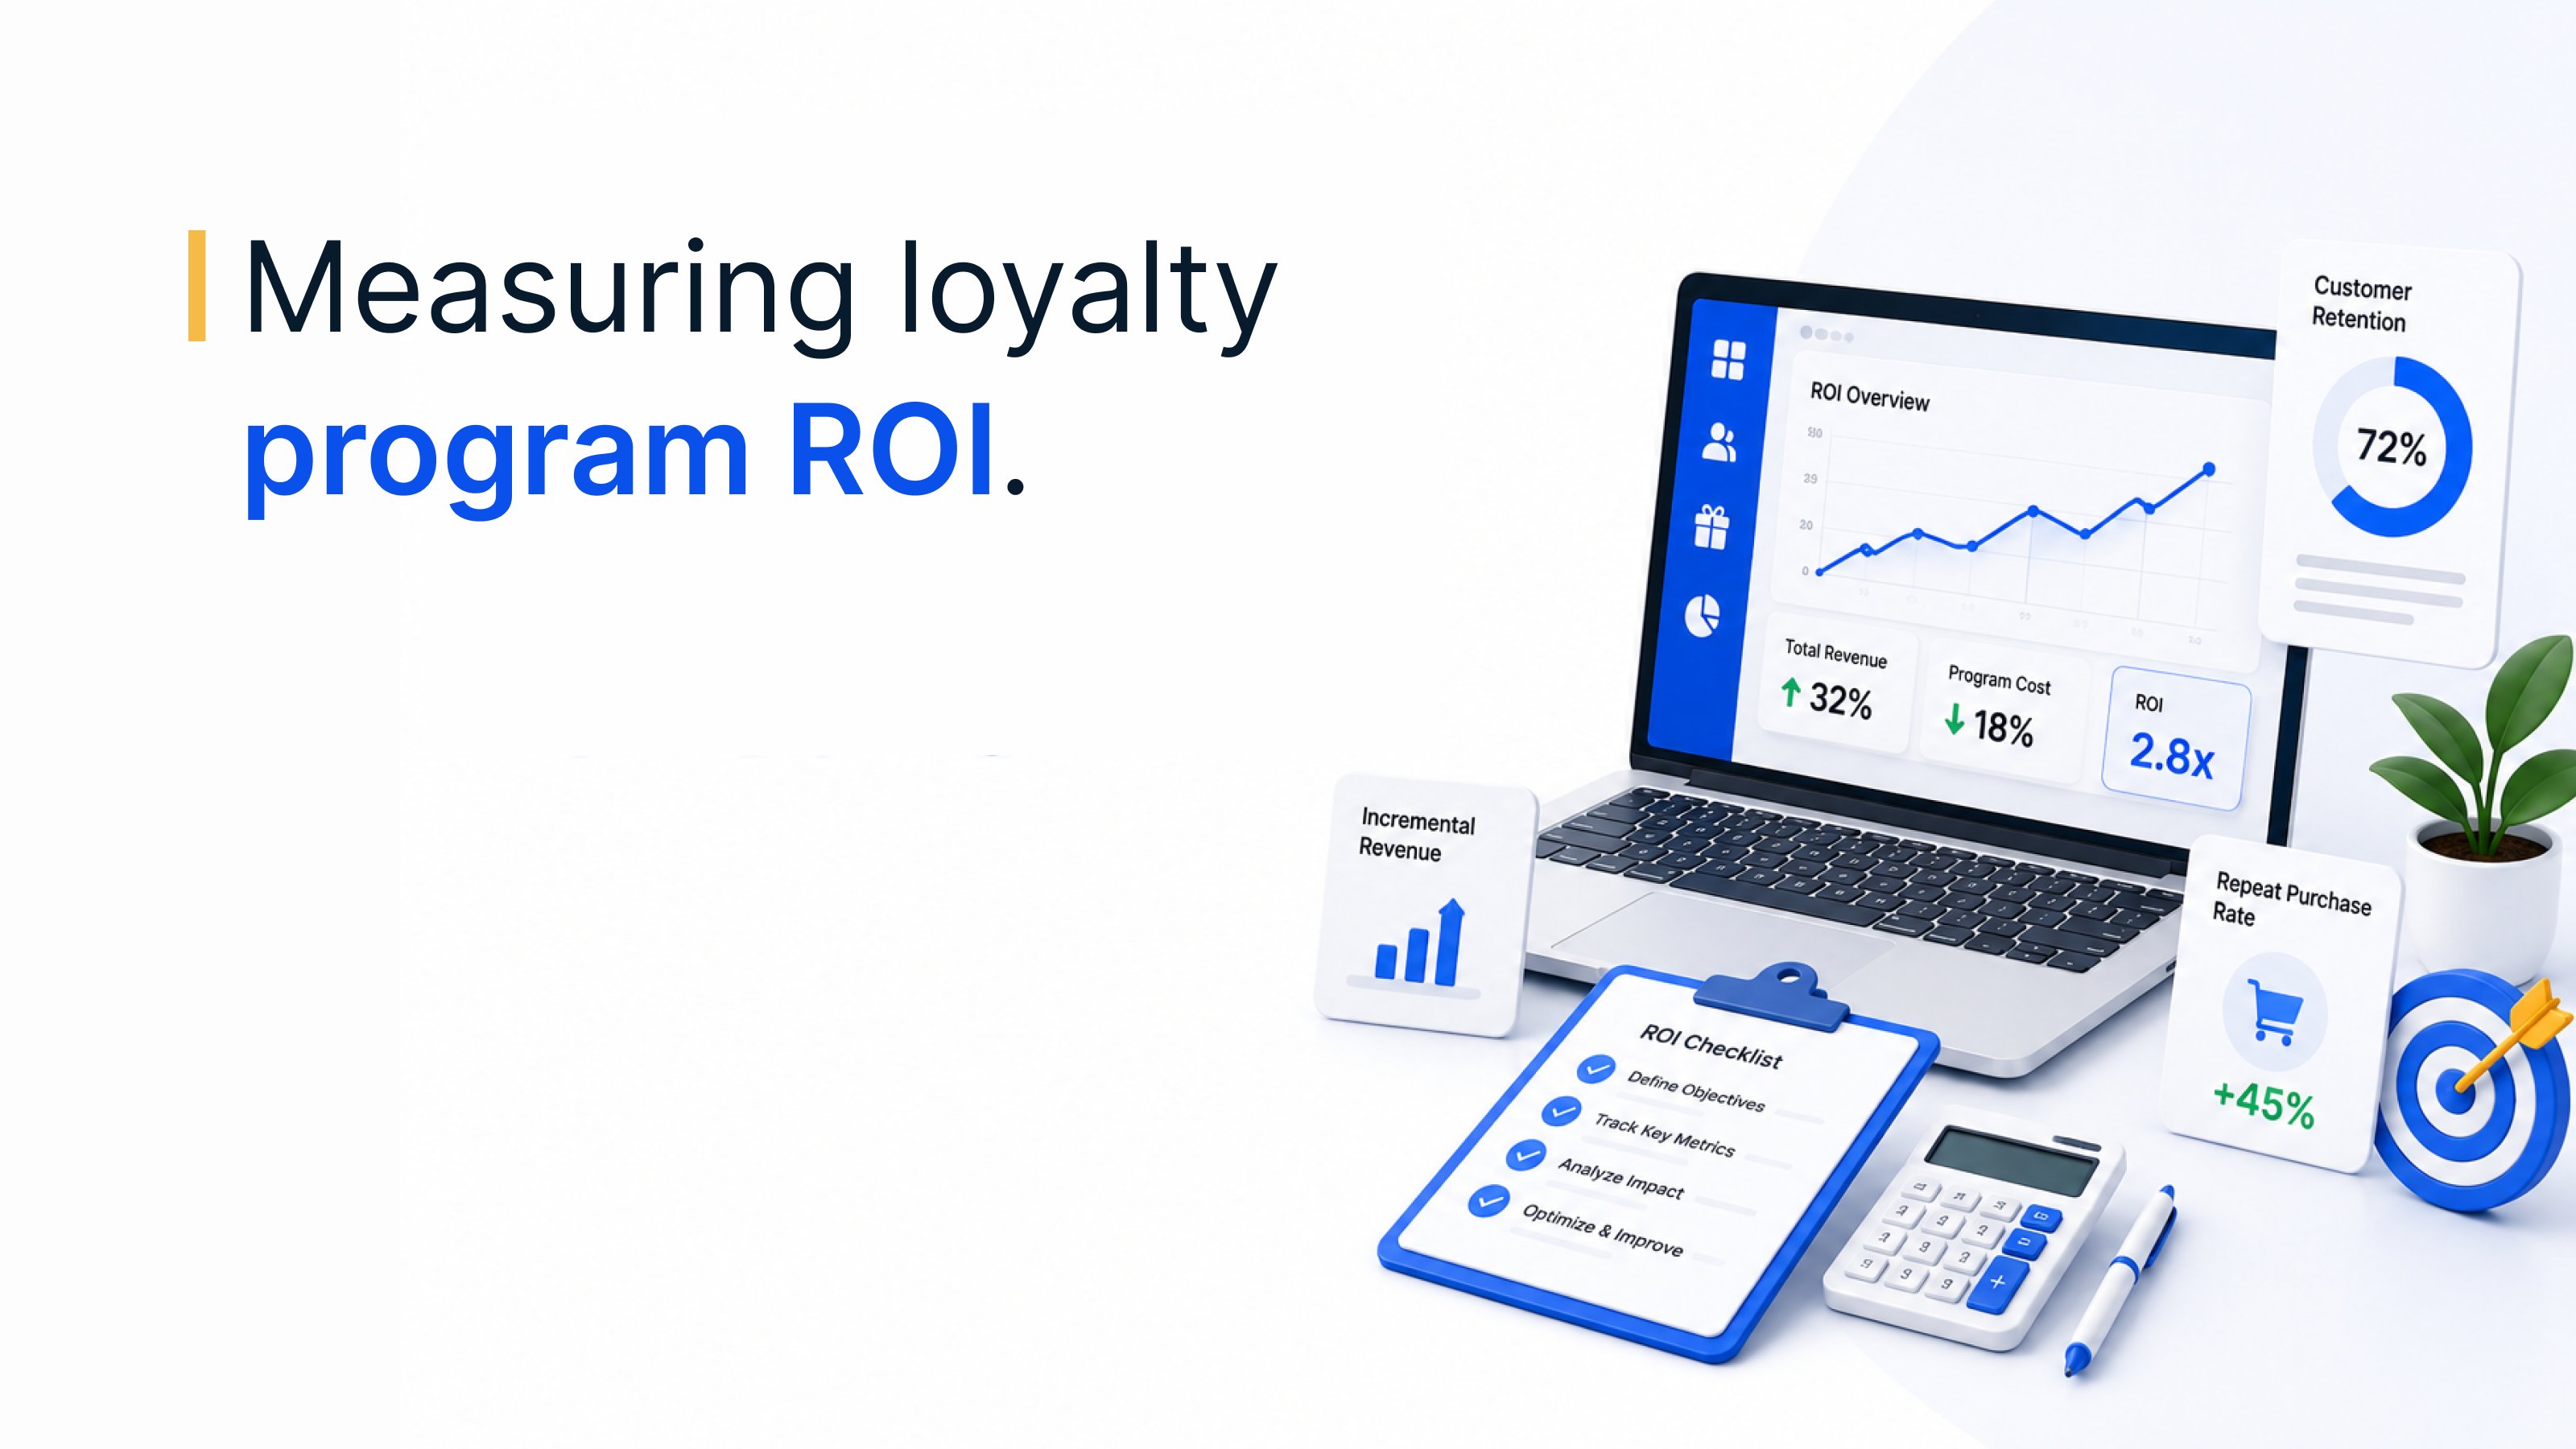
For a deeper look at the cost side of rewards programs, see our guide to employee rewarding ROI, or estimate recognition returns with the Empuls recognition ROI calculator.
Measure employee experience continuously
Run eNPS, pulse and lifecycle surveys in Empuls and turn the results into action plans.
Talk to our ExpertTrusted by 5,000+ companies
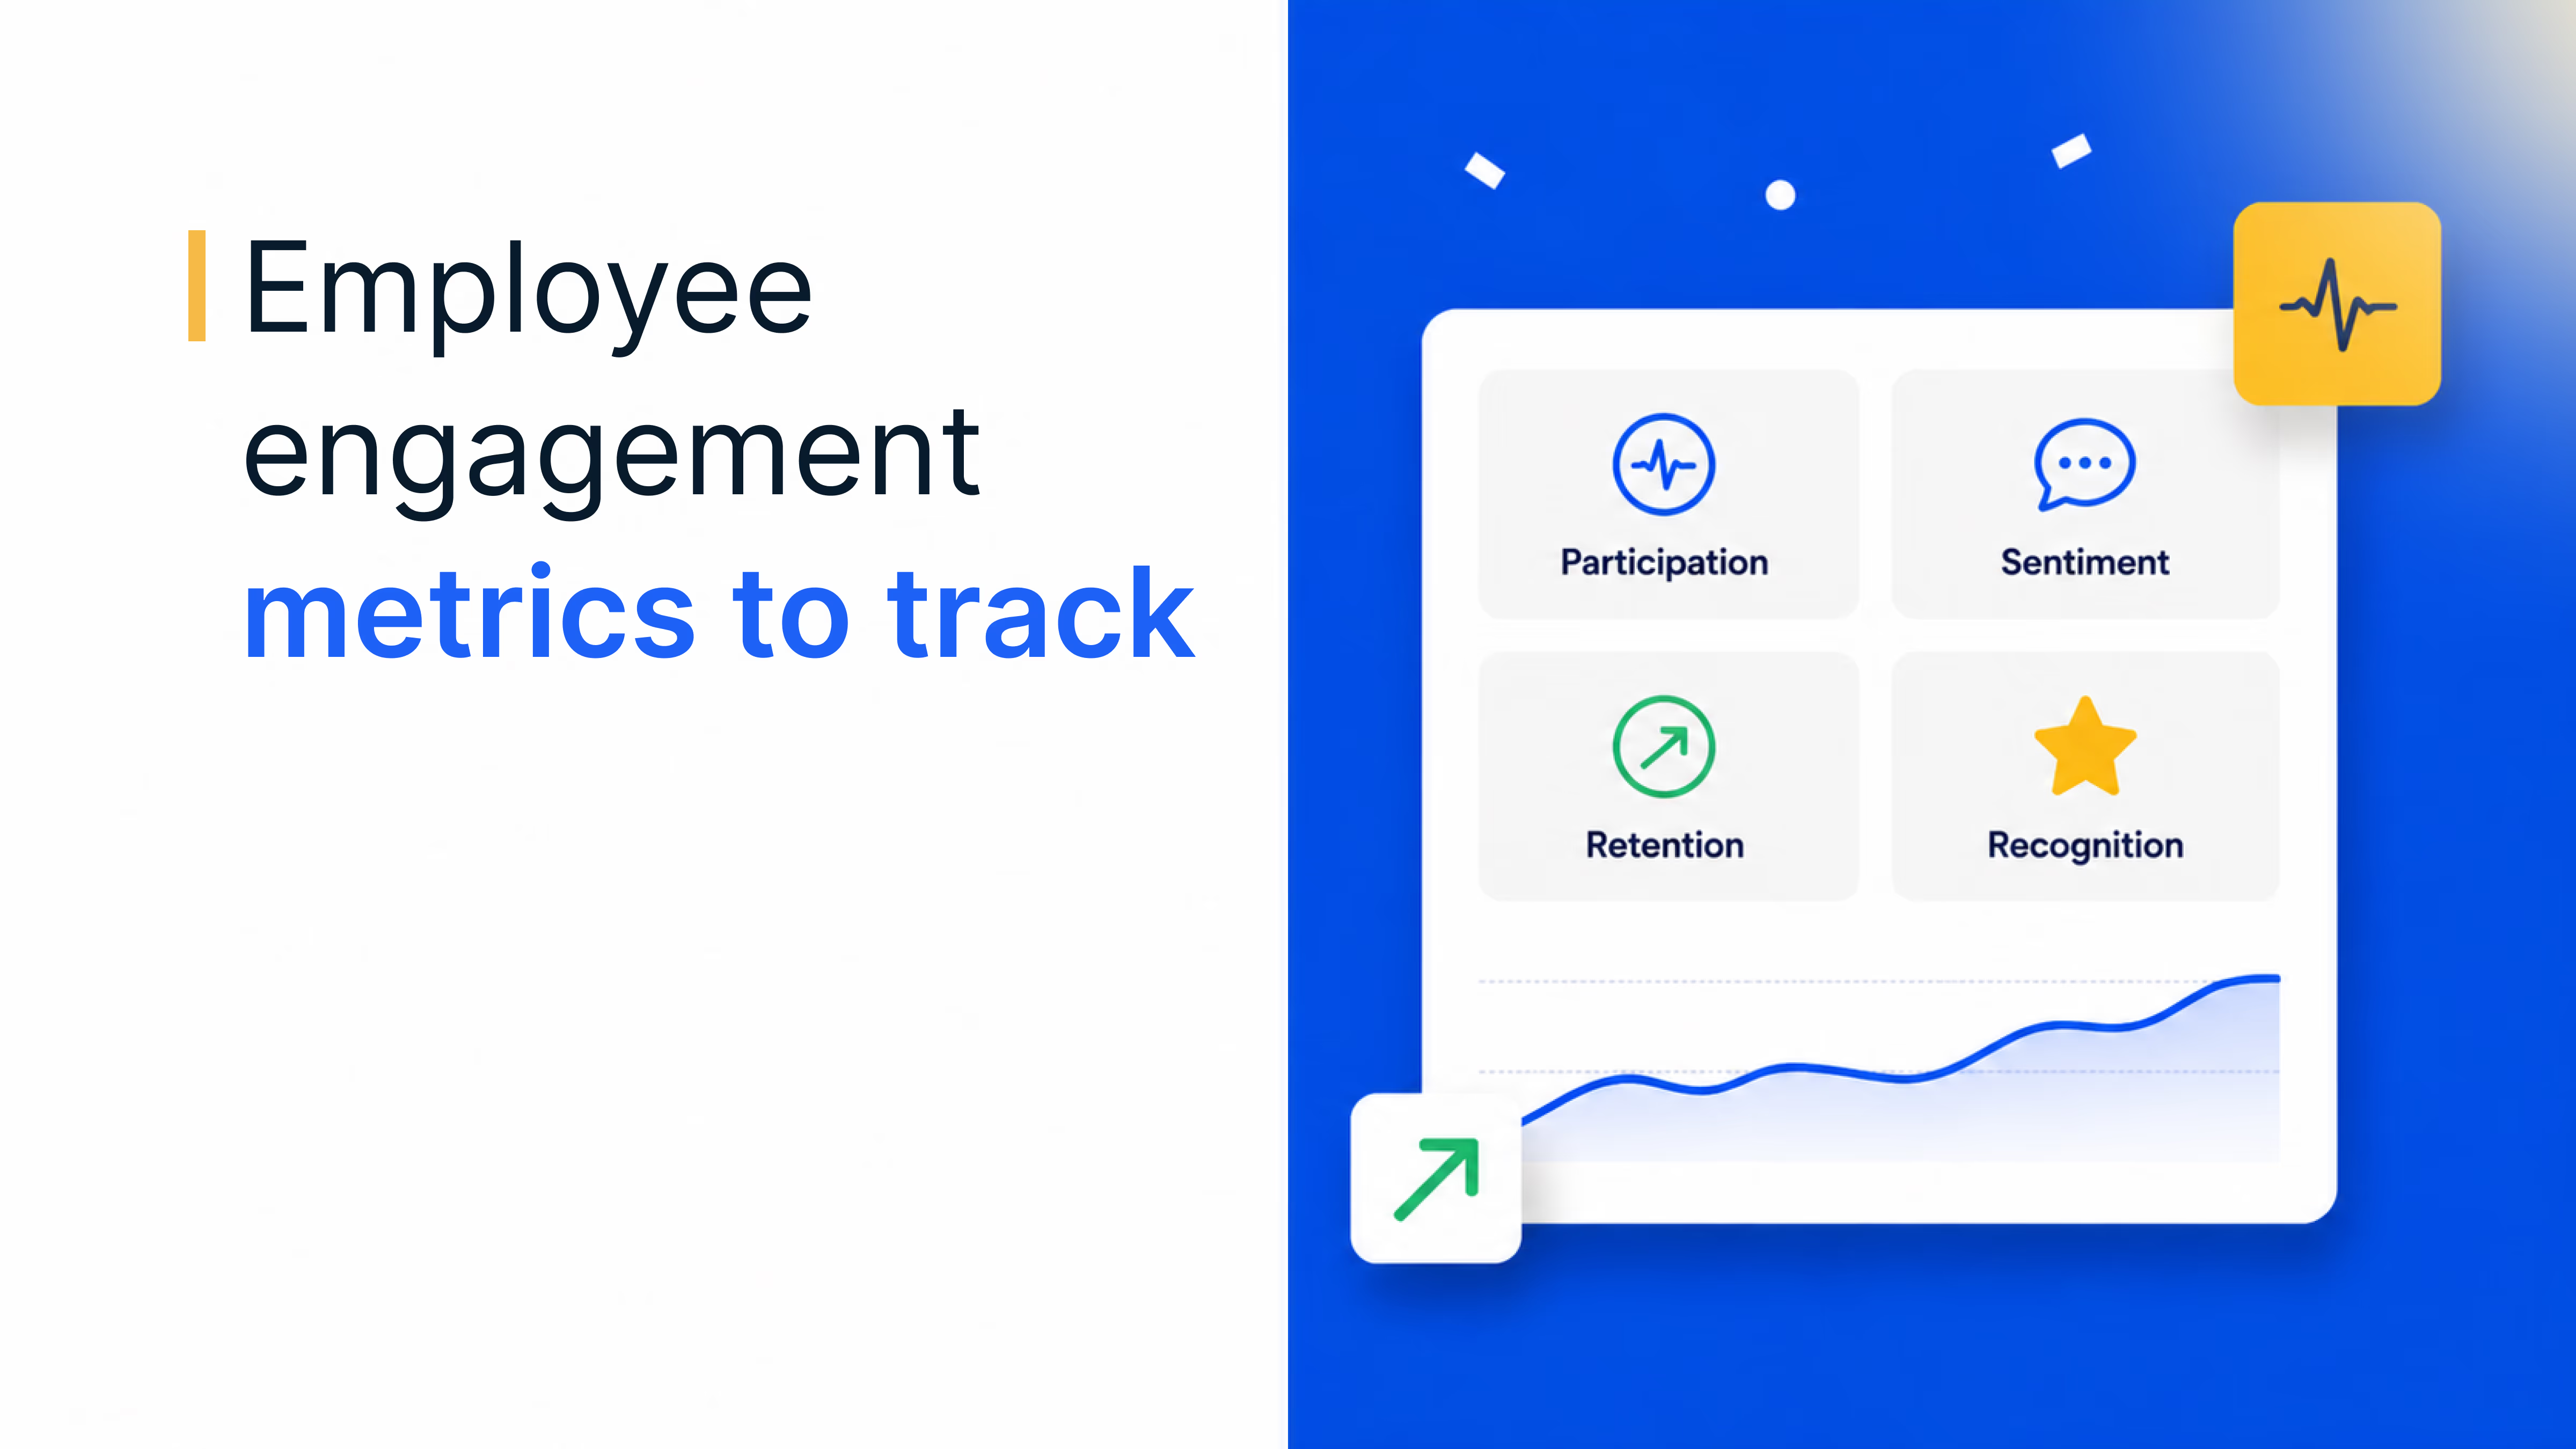
9 key employee experience metrics to track
Creating a positive employee experience isn't just about offering perks. It is about understanding what drives engagement, satisfaction and retention, and tracking the right metrics shows what is working, where to improve and how to strengthen your culture.
There are nine metrics most teams need, ordered from the quickest to collect to the closest to business results. eNPS comes first because it is the simplest single signal, and customer outcomes come last because they take longest to move.
1. Employee net promoter score (eNPS)
Employee net promoter score is a quick way to measure overall satisfaction and loyalty. A high eNPS shows that employees feel valued and engaged, while a low score suggests dissatisfaction and a risk of attrition. Employees answer one question: "On a scale of 0 to 10, how likely are you to recommend this company as a great place to work?" Responses fall into three groups:
- Promoters (9 to 10): Highly satisfied employees who actively endorse the company.
- Passives (7 to 8): Neutral employees who are neither highly engaged nor dissatisfied.
- Detractors (0 to 6): Unhappy employees who may hurt morale.
eNPS = % of promoters − % of detractors. If 50% of respondents are promoters and 20% are detractors, your eNPS is 50 − 20 = 30. Scores range from −100 to +100, and a higher score means employees are more likely to stay and recommend the company.
2. Employee engagement score
Engagement is a strong predictor of productivity, innovation and retention. Highly engaged employees are not just satisfied. They are emotionally invested in their work and motivated to contribute. Engagement surveys should include questions on:
- Job satisfaction
- Relationships with managers and colleagues
- Growth and development opportunities
- Work-life balance
- Sense of purpose at work
Responses are usually collected on a 1 to 5 or 1 to 10 scale, and the overall score reflects engagement levels. An average of 4.2 out of 5 suggests a strong culture, while a score below 3 points to disengagement. Gallup's 2024 Q12 meta-analysis found that top-quartile engagement units have 23% higher profitability and 78% less absenteeism than bottom-quartile units. Our guide to the employee engagement index explains how to calculate and benchmark it.
3. Retention and turnover rates
High turnover is costly, hurts productivity and disrupts teams. Retention rates, on the other hand, reflect job satisfaction and a positive culture. Calculate both every month or quarter:
- Turnover rate (%): (Number of employees who left during the period ÷ Average number of employees) × 100. If 20 people leave and the average headcount is 200, turnover is 10%.
- Retention rate (%): (Employees at the end of the period who were there at the start ÷ Employees at the start) × 100. If 450 of 500 employees remain, retention is 90%.
Track regretted turnover and 90-day turnover separately. A high retention rate suggests employees are satisfied, while high turnover signals deeper problems such as poor management, low engagement or a lack of career growth.
4. Productivity and performance metrics
Employee experience directly affects performance. A disengaged workforce struggles with inefficiency, while motivated employees drive innovation and output. Measure:
- Task completion rates: The share of assigned work completed on time.
- Quality of work: Error rates, customer feedback and peer reviews.
- Project efficiency: Speed and effectiveness in delivering key initiatives.
- Time to productivity: How long new hires take to reach full performance.
If productivity drops while hours stay the same, it may point to burnout, low morale or ineffective systems.
5. Employee wellbeing and work-life balance
A workplace that prioritizes wellbeing sees higher engagement, less burnout and better job satisfaction. Employees who feel supported in managing work and personal life are more productive and stay longer. Measure:
- Absenteeism rate: The share of workdays missed due to stress, illness or personal reasons.
- Wellness program participation: How many employees use mental health support, fitness initiatives or flexible work options.
- Workload balance: Employee feedback on stress levels and whether workloads are manageable.
High absenteeism or low participation in wellbeing programs can signal problems with workload or workplace stress.
6. Career growth and development
Employees who see growth opportunities are more likely to stay. In Gallup's 2024 turnover study, career advancement was one of the top changes that would have prevented a voluntary exit. Measure:
- Training participation rate: The share of employees enrolling in skill development programs.
- Internal promotions vs external hires: A higher internal promotion rate shows real career paths.
- Learning feedback: Survey responses on the quality of training and career support.
7. Feedback and communication effectiveness
Open communication builds trust, collaboration and a positive culture. When employees feel heard, they are more engaged and productive. Measure:
- Frequency of feedback conversations: One-on-ones, team check-ins and performance reviews held.
- Employee sentiment analysis: AI tools that analyze survey comments and feedback to gauge morale.
- Participation in meetings and forums: Higher participation shows people are comfortable speaking up.
- Action rate: The share of survey findings that led to a visible change.
If employees are reluctant to give feedback or communication feels one-sided, you need more transparency and leadership involvement. Our post on why annual employee surveys fail explains how to build a listening program that works.
8. Use of HR tech and digital tools
Inefficient tools and outdated systems frustrate employees and slow work down. Modern HR and collaboration tools improve workflows, automate tasks and lift the overall experience. Measure:
- Adoption rate: The share of employees actively using HR, collaboration or engagement tools.
- Time saved through automation: The reduction in manual processes and admin work.
- Tool satisfaction: Survey feedback on ease of use and usefulness.
Low adoption or negative feedback may mean you need better training or simpler tools.
9. Customer satisfaction and business outcomes
Happy employees deliver better customer service and stronger business performance. Gallup's meta-analysis found 10% higher customer loyalty in top-quartile engagement units. Measure:
- Customer satisfaction (CSAT): Compare engagement by team with customer ratings for the same team.
- Net promoter score (NPS): Check whether highly engaged teams drive stronger customer advocacy.
- Revenue and productivity trends: If experience metrics improve, business performance should follow.
Here are all nine employee experience metrics in one place:
| Metric | How to calculate or collect it | How often |
|---|---|---|
| eNPS | % promoters − % detractors | Quarterly |
| Engagement score | Average of engagement survey items | Twice a year, plus pulses |
| Turnover and retention | Leavers ÷ average headcount; stayers ÷ starting headcount | Monthly or quarterly |
| Productivity | Task completion, quality, time to productivity | Monthly |
| Wellbeing | Absenteeism, program participation, workload scores | Monthly or quarterly |
| Career growth | Training participation, internal promotion rate | Quarterly |
| Feedback and communication | Participation, sentiment, action rate | After each survey cycle |
| HR tech adoption | Active users ÷ eligible users, tool satisfaction | Quarterly |
| Customer outcomes | CSAT or NPS by team compared with engagement | Quarterly |
How to measure employee experience in 6 steps
Knowing the metrics is only half the work. Here is how to measure employee experience in a way leaders will trust:
- Set the goal: Decide which business problem you are solving, such as early attrition, low productivity or weak customer scores.
- Pick a few metrics: Choose one or two metrics per level of the framework rather than tracking everything.
- Capture a baseline: Record current values before you launch any initiative.
- Listen across the lifecycle: Combine pulse surveys with onboarding, exit and other lifecycle surveys so you see every stage.
- Segment the data: Compare teams, locations, tenure bands and roles, because averages hide the real problems.
- Act, then re-measure: Change one or two things, share what you changed and measure again over the same period length.
To decide what to change once you have the data, read how to improve employee experience and the pillars of employee experience.
Presenting employee experience ROI to leadership
Even good numbers can fall flat if they are presented as an HR report. Frame the results the way leaders already think about the business:
- Lead with money: Open with turnover savings, productivity gains or customer results, then show the experience scores behind them.
- Show the trend: Compare before and after, or improving teams with the rest, rather than a single snapshot.
- Be honest about attribution: Say what else changed in the period and use control groups where you can.
- Ask for a specific decision: End with the next investment and the result you expect from it.
Measure and elevate employee experience with Empuls
Understanding employee experience goes beyond a single survey. It needs real-time insight and data you can act on. Empuls, Xoxoday's employee engagement platform, gives you pulse, eNPS and lifecycle surveys, AI sentiment analysis and action plans, so you can measure satisfaction, wellbeing and culture continuously.
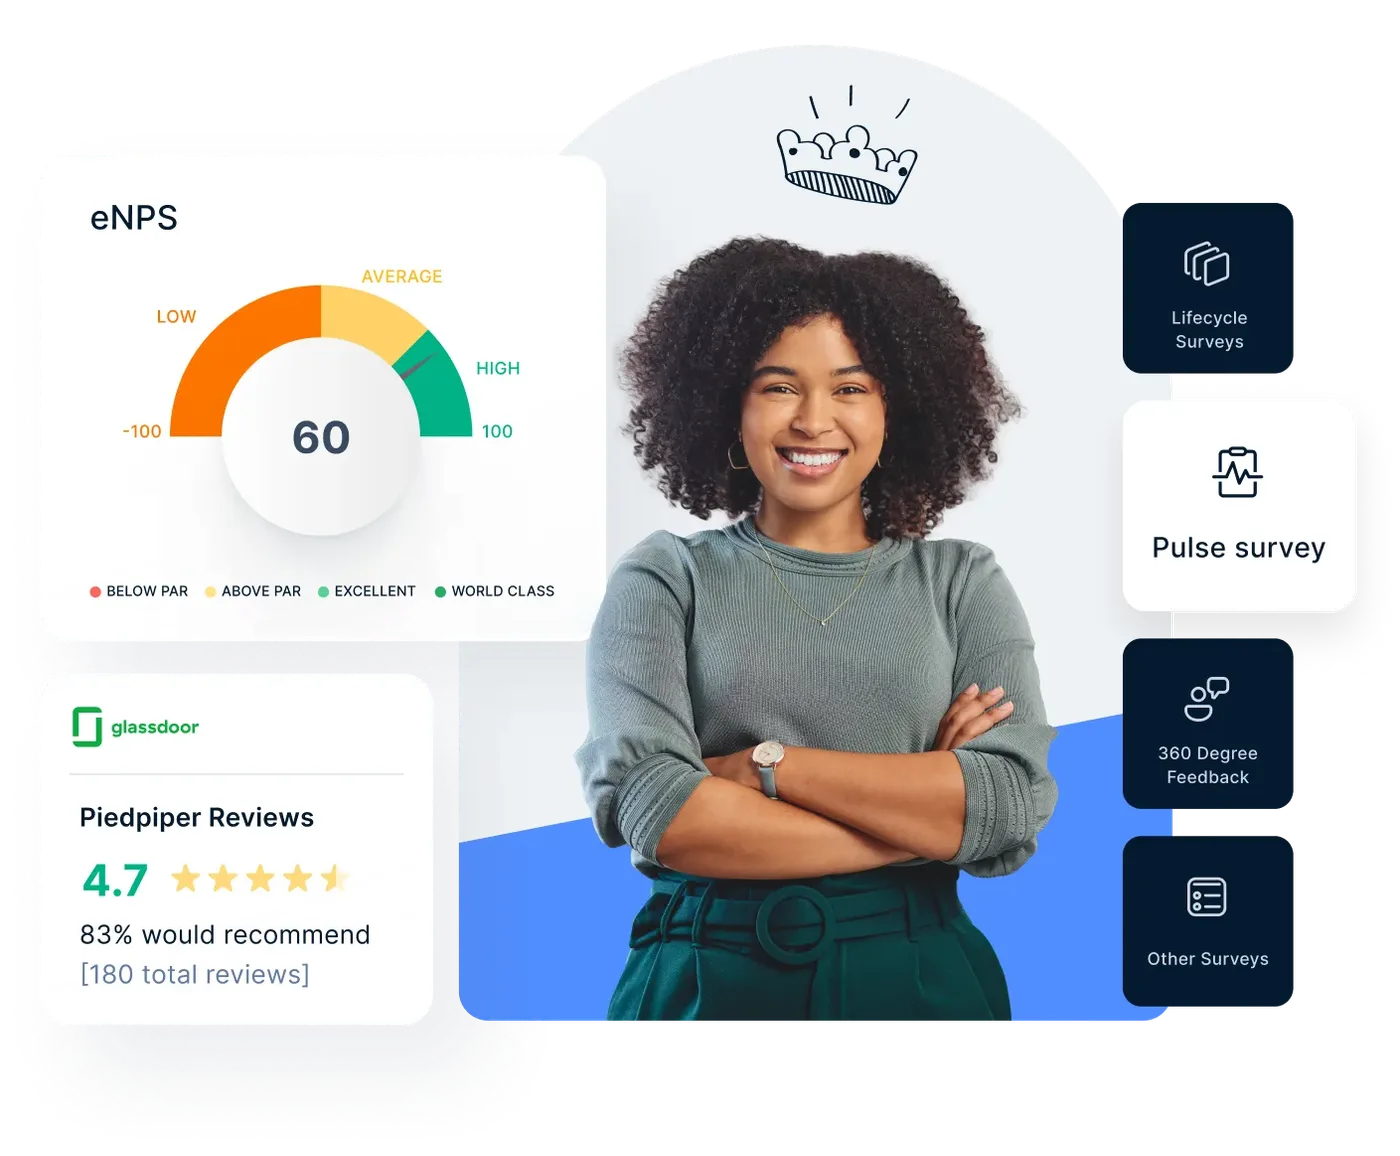
With reports and analytics on engagement, eNPS and recognition, you can spot trends in engagement and retention by team and link them to the programs you run, such as recognition and benefits.
Improving your employee experiences
The impact of employee experience goes beyond individual satisfaction. It directly influences business growth, customer success and culture. Companies that measure employee experience metrics unlock both financial and non-financial benefits, from better retention to higher productivity and stronger customer relationships.
Organizations where leadership and HR work together to value and develop employees build a workplace that thrives on engagement, cohesion and shared purpose. By tracking engagement, wellbeing, career development and ROI, you can make informed decisions that drive sustainable growth. The better the employee experience, the higher the return, which makes it a strategic investment rather than a cost.
Book your Empuls demo
Frequently asked questions
Measure employee experience by combining survey data with operational data. Run eNPS, engagement, pulse and lifecycle surveys to capture how employees feel, then track behavior metrics such as absenteeism, internal mobility and turnover. Link these to business outcomes such as productivity and customer satisfaction, compare results by team and re-measure after each change you make.
The most useful employee experience metrics are eNPS, engagement score, turnover and retention rates, time to productivity, absenteeism, wellbeing program participation, internal promotion rate, survey action rate, HR tool adoption and customer satisfaction by team. Most organizations should start with four or five of these, set baselines and add more once the first set is tracked reliably.
Calculate employee experience ROI by subtracting the cost of an initiative from its total gains, dividing by the cost and multiplying by 100. Gains usually include turnover savings, productivity improvements and lower absenteeism. For example, a $45,000 program that produces $115,000 in gains has an ROI of 155.6%, meaning each dollar returned about $2.56 in total gains.
eNPS ranges from minus 100 to plus 100, and any score above zero means you have more promoters than detractors. Published benchmarks vary widely by industry, region, company size and survey provider, so compare yourself mainly with your own past results. The trend over time and the gap between teams usually tell you more than a single external benchmark.
Employee engagement metrics measure how invested employees feel, usually through engagement surveys and eNPS. Employee experience metrics are broader and cover every stage of the lifecycle, including candidate experience, onboarding, tool satisfaction, wellbeing, internal mobility and exit feedback. Engagement is one key outcome inside a wider employee experience measurement framework.
Measure employee experience continuously rather than once a year. A common rhythm is short pulse surveys monthly or quarterly, eNPS every quarter, a deeper engagement survey once or twice a year and lifecycle surveys at onboarding, key milestones and exit. Operational metrics such as turnover and absenteeism should be reviewed monthly alongside the survey results.
An employee experience measurement framework is a structured way to connect what employees say to what the business gains. A simple version has four levels: listening, such as survey participation; experience, such as eNPS; behavior, such as absenteeism and turnover; and business results, such as revenue per employee and customer satisfaction. Each level needs its own metrics and baseline.
Employee experience is usually measured with an employee survey or engagement platform that runs pulse, eNPS and lifecycle surveys, analyzes comments with AI and tracks action plans. These platforms work best when connected to your HR system for turnover and tenure data. Look for anonymity controls, segment-level reporting and the ability to link survey results to programs such as recognition.