Key Takeaways
To measure employee engagement, combine what employees say (surveys, pulses, eNPS) with what they do (turnover, absence, recognition, referrals) and track both against a baseline.
Gallup's 2024 meta-analysis found top-quartile engaged teams have 23% higher profitability and 78% lower absenteeism than bottom-quartile teams.
A balanced engagement scorecard mixes leading indicators, such as eNPS and participation, with lagging indicators, such as turnover and productivity.
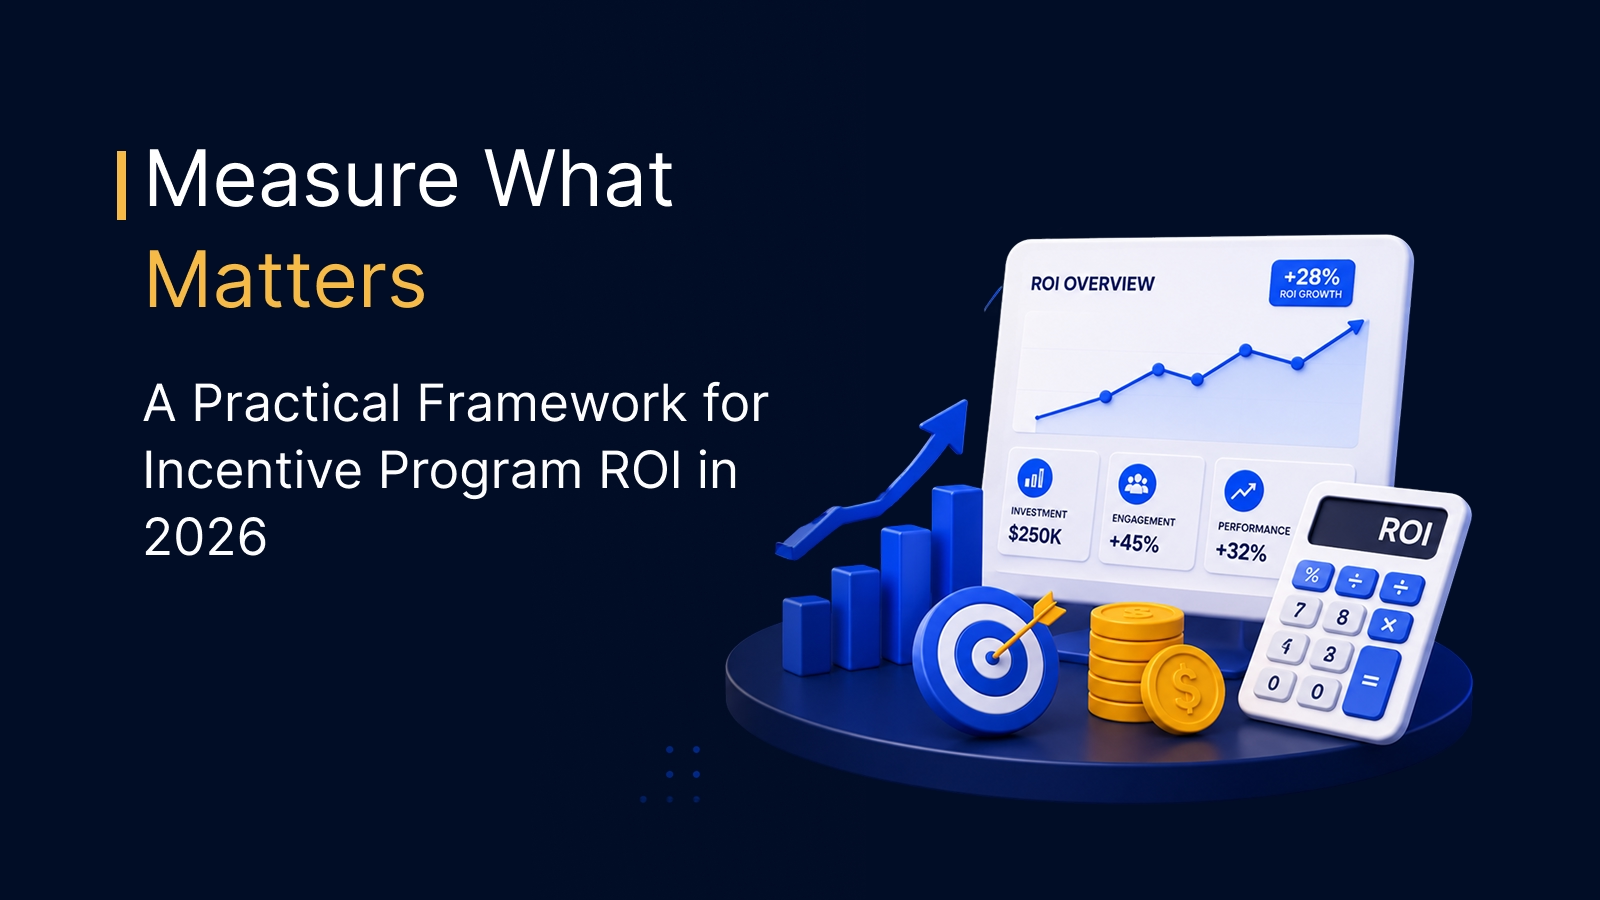
Employee engagement ROI equals program benefits minus costs, divided by costs, times 100, and is most credible when you compare a pilot group with a similar group.
Review engagement metrics by team and tenure every quarter, because company averages hide the teams that need help.
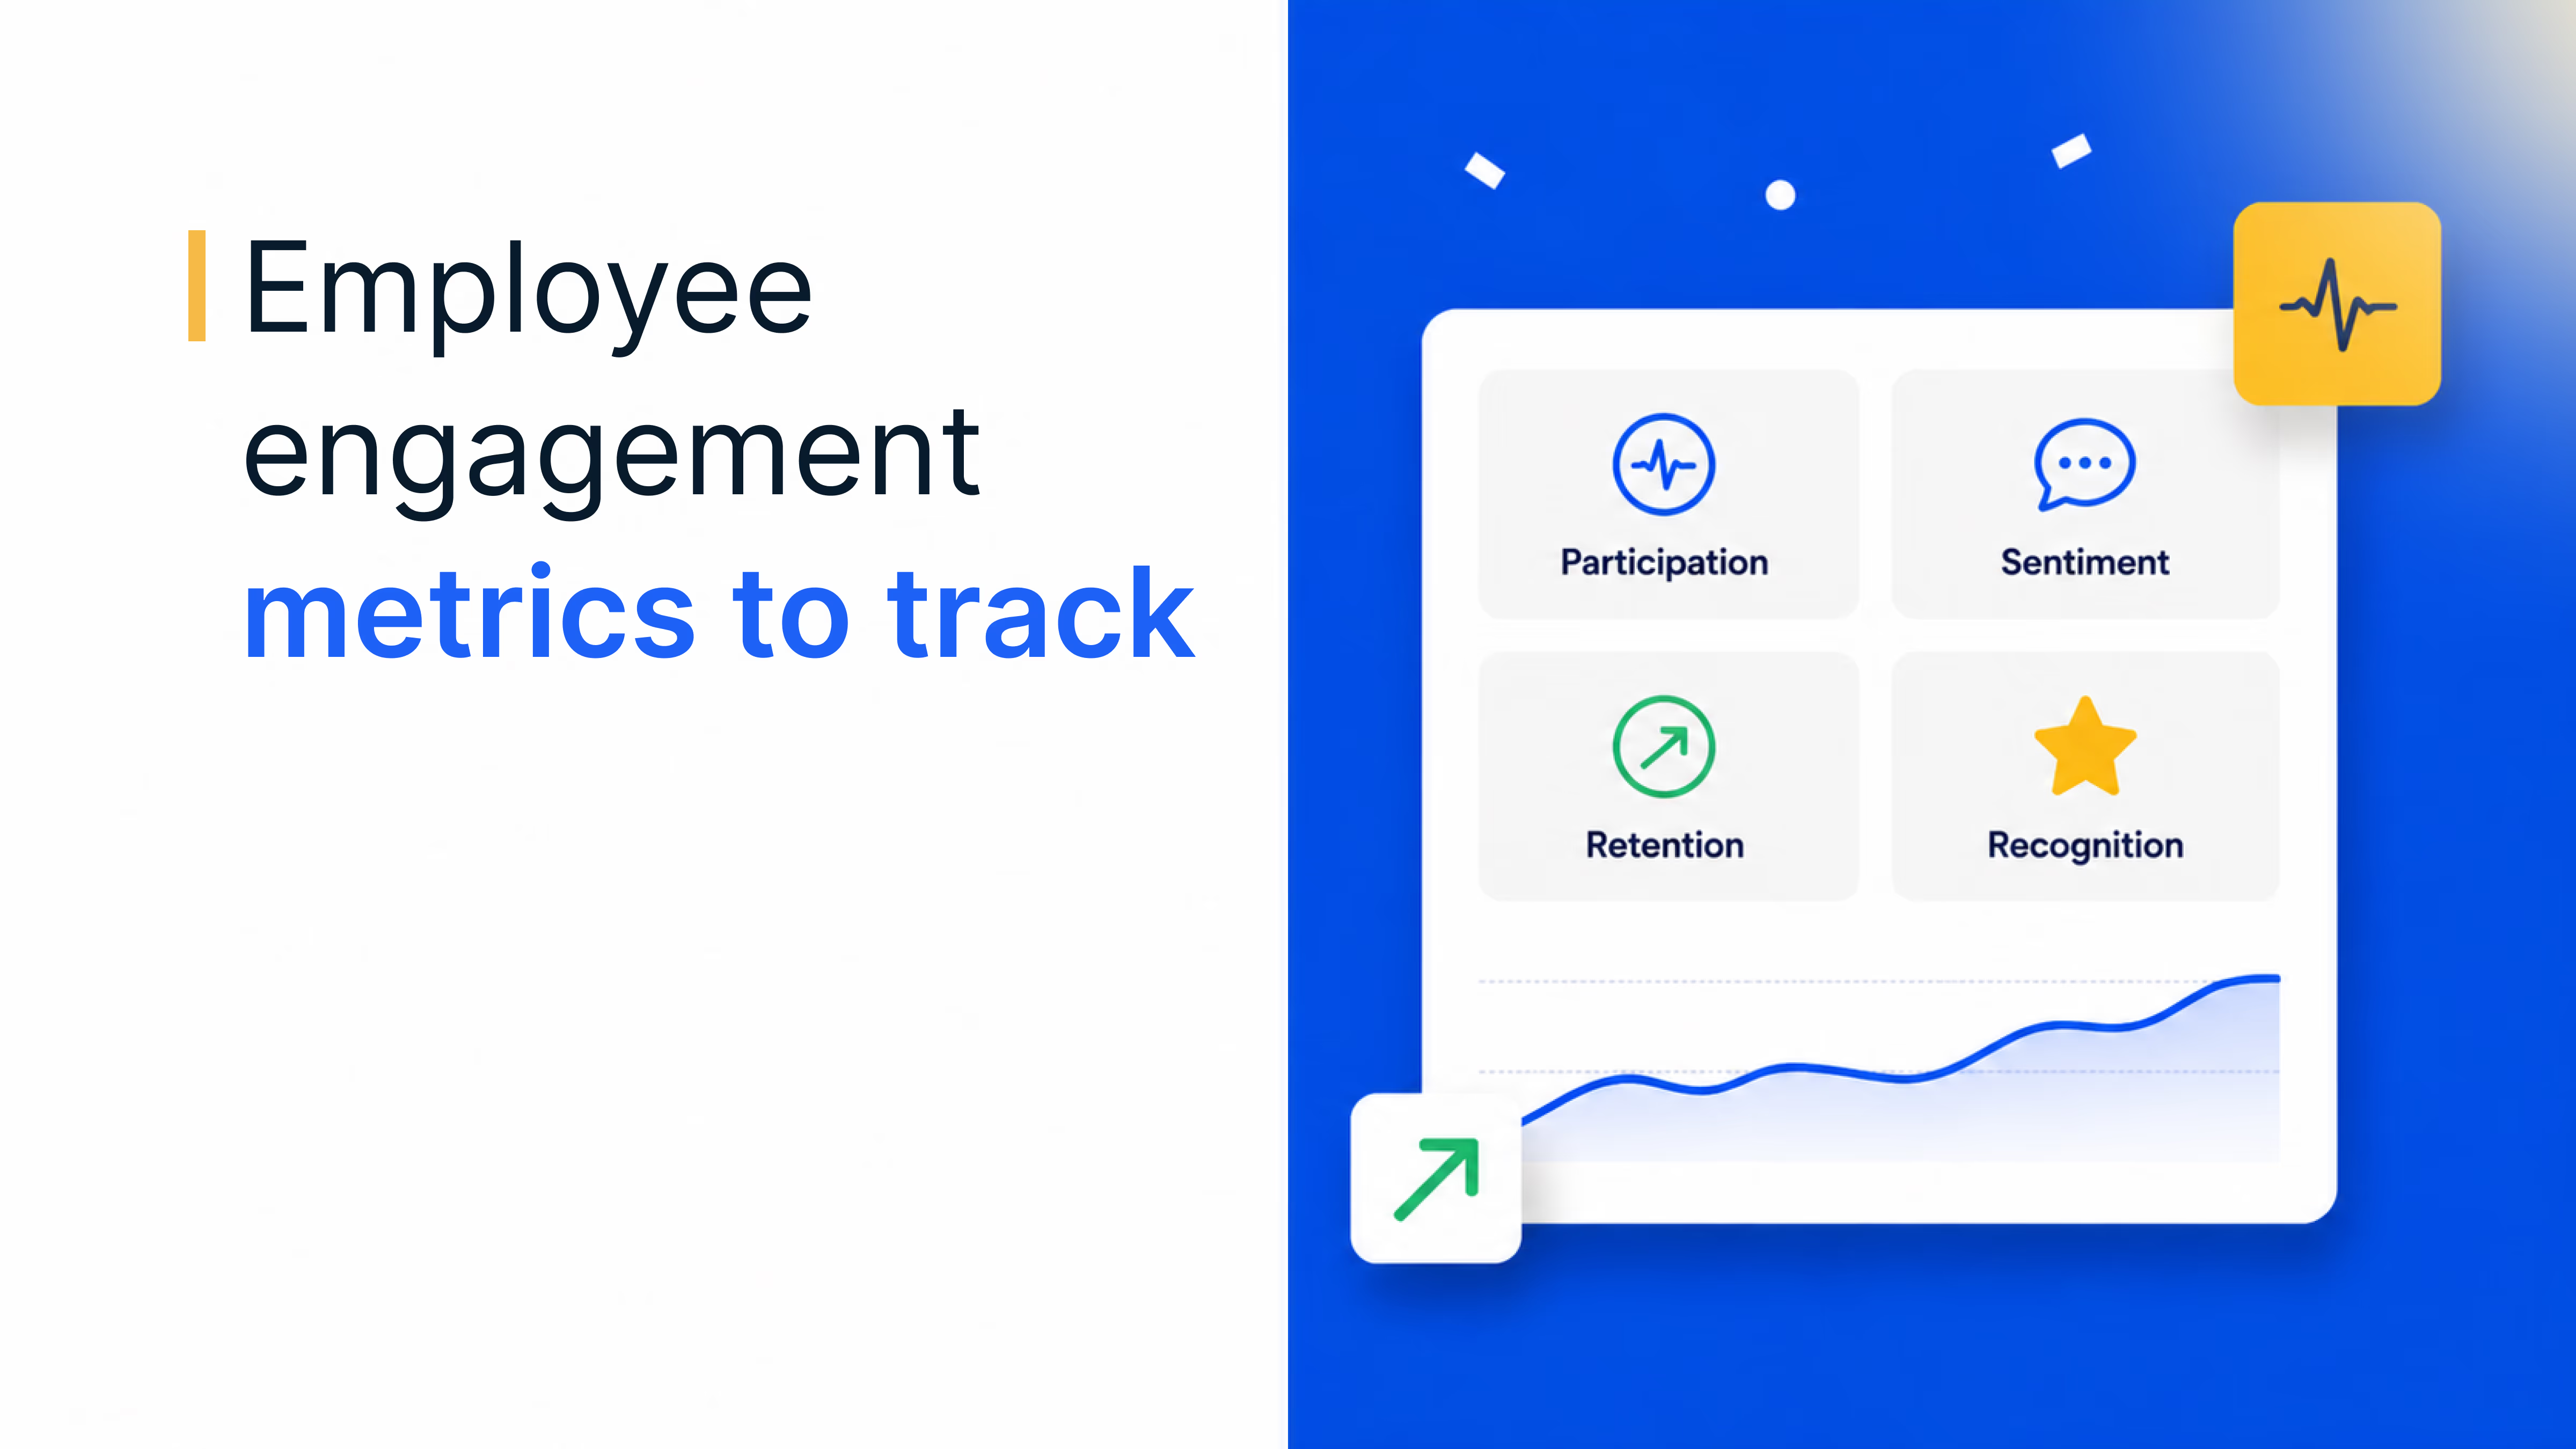
To measure employee engagement, combine what employees tell you (engagement surveys, pulse surveys and eNPS) with what they do (retention, absenteeism, productivity, recognition and referrals), then track both against a baseline every quarter. Measuring employee engagement means turning how committed, motivated and connected people feel into a small set of metrics you can trend, compare by team and link to business results.
For employee engagement to move from a nice-to-have to a measurable business initiative, you need the right employee engagement metrics and a way to show the ROI of the programs behind them. This guide covers how to measure employee engagement with the main measurement methods, 14 key metrics and their formulas, a ready-to-use engagement KPI scorecard and a step-by-step method for calculating employee engagement ROI.
Why measuring employee engagement pays off
Engagement is one of the few people measures with decades of evidence linking it to business results. Gallup's 2024 Q12 meta-analysis of 183,806 business and work units across 347 organizations, summarized in its research on engagement and productivity, compared top-quartile and bottom-quartile teams:
23%
higher profitability
top vs bottom quartile teams
18%
higher sales productivity
top vs bottom quartile teams
78%
lower absenteeism
top vs bottom quartile teams
51%
lower turnover
in low-turnover organizations
What engaged teams deliver. Source: Gallup 2024 Q12 meta-analysis
Yet most workforces are not there. Gallup's State of the Global Workplace 2026 found only 20% of employees worldwide were engaged in 2025, the lowest level since 2020. Without measurement, you cannot tell whether your own teams sit above or below that line, which programs are working or where to spend next.
Engagement measurement methods
There is no single best way to measure engagement; strong programs mix a few methods so they hear from employees at different moments and in different depths. The table compares the most common engagement measurement methods.
| Method | What it captures | Typical cadence | Best for |
|---|---|---|---|
| Annual or biannual engagement survey | Engagement drivers in depth: manager, growth, recognition, purpose, workload | Once or twice a year | Full diagnosis and benchmarking |
| Pulse survey | A few key questions on current sentiment | Weekly to quarterly | Spotting changes early |
| eNPS | Loyalty and willingness to recommend the employer | Monthly or quarterly | A fast, trendable headline score |
| Lifecycle surveys | Experience at onboarding, training, reviews and exit | Triggered by milestones | Fixing specific stages of the journey |
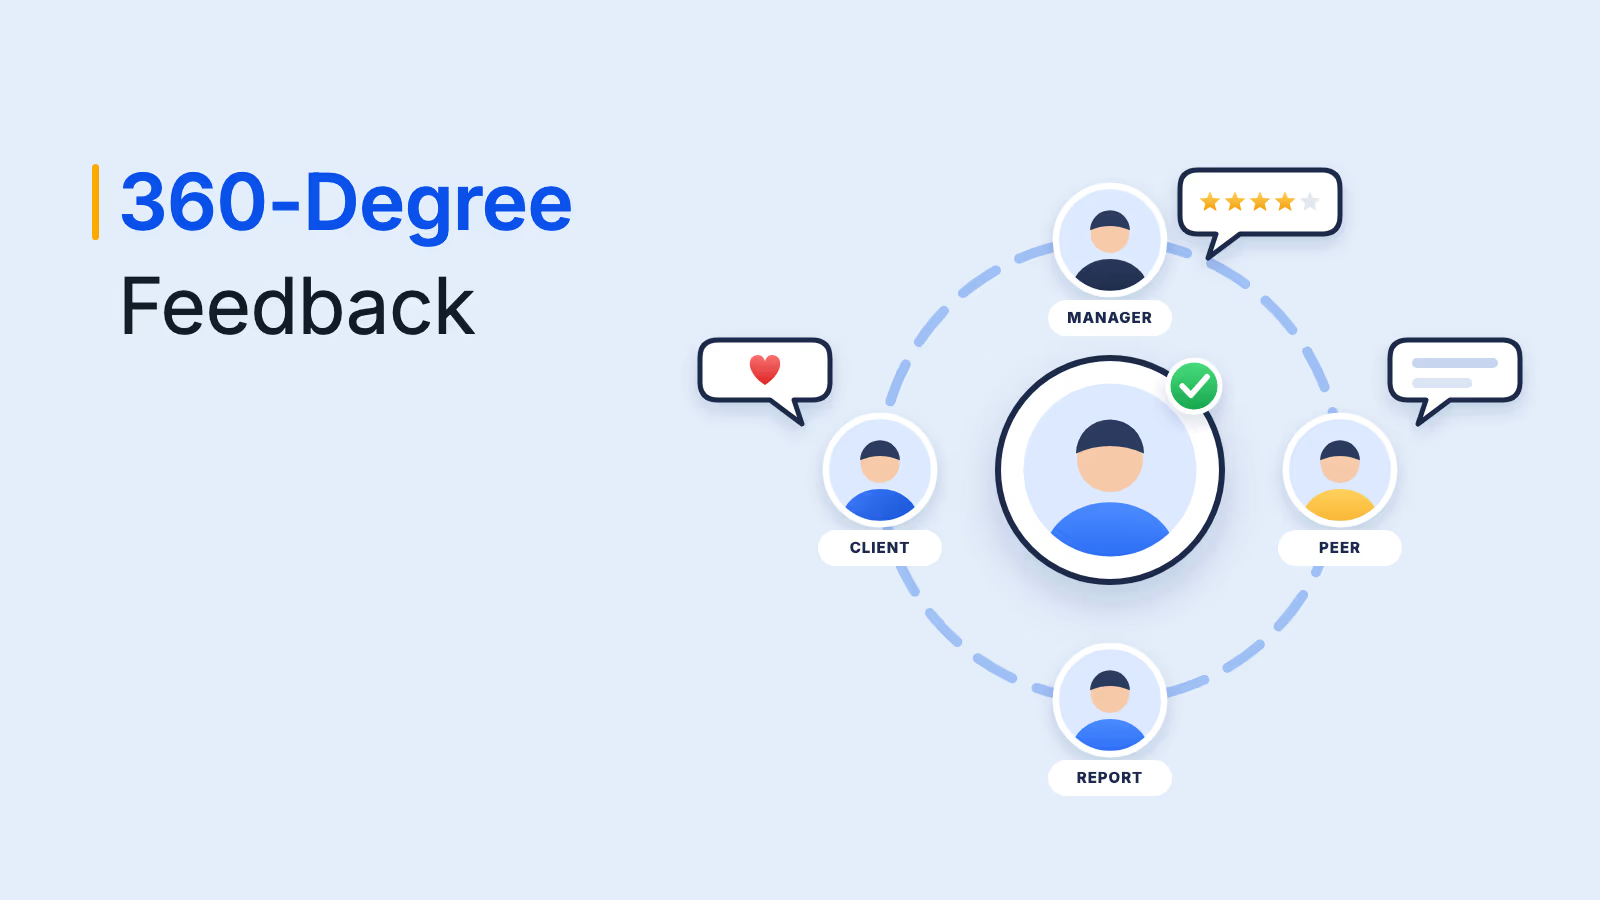
| 360-degree feedback | How peers, managers and reports see an individual | Once or twice a year | Manager and leadership development |
| Focus groups and stay interviews | The reasons behind survey scores | As needed | Depth on a specific issue |
| People analytics | Behavior data: turnover, absence, recognition, training, referrals | Monthly | Validating survey results with actions |
Lifecycle surveys deserve a special mention because they catch problems at the moment they happen rather than months later. A simple schedule might look like this:
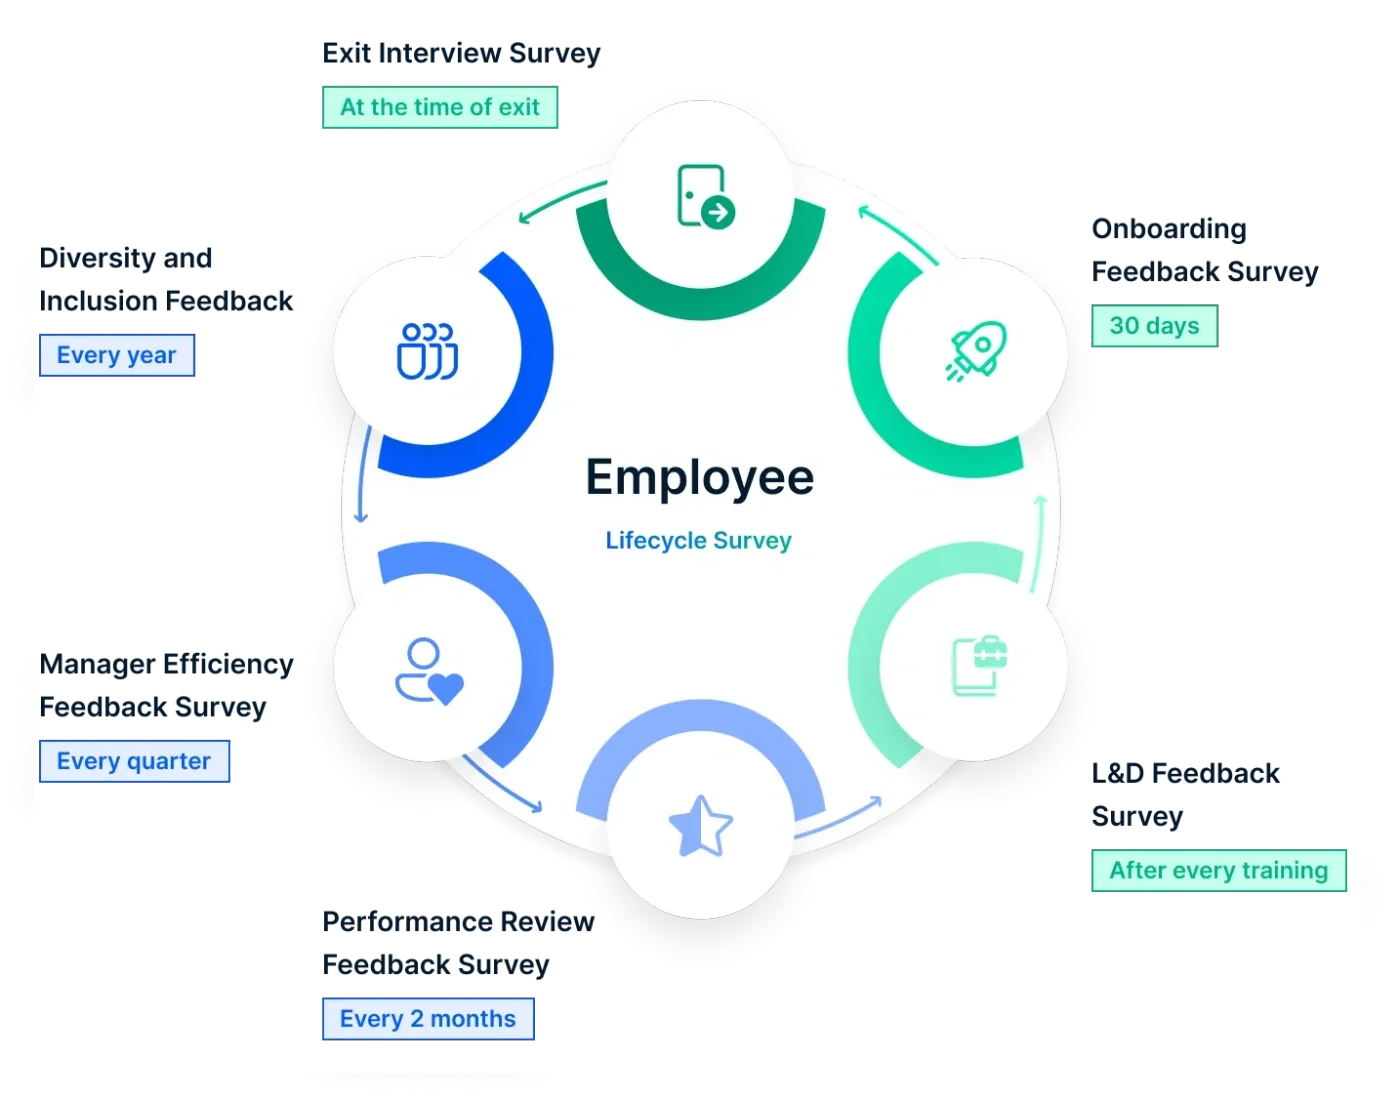
For question ideas for each method, see this guide to the employee engagement survey, the employee pulse survey and 360-degree feedback.
Track engagement metrics in one dashboard
See eNPS, driver scores and participation by team, benchmarked and trended over time.
Talk to our ExpertTrusted by 5,000+ companies
14 employee engagement metrics to track
The 14 employee engagement metrics below cover three kinds of signal: what employees say (metrics 1 to 6), what they do (7 to 11) and how much they invest in the company's future (12 to 14). Start with eNPS, an engagement survey score and turnover, because together they give you a sentiment measure, a driver measure and a business outcome.
1. Employee net promoter score (eNPS)
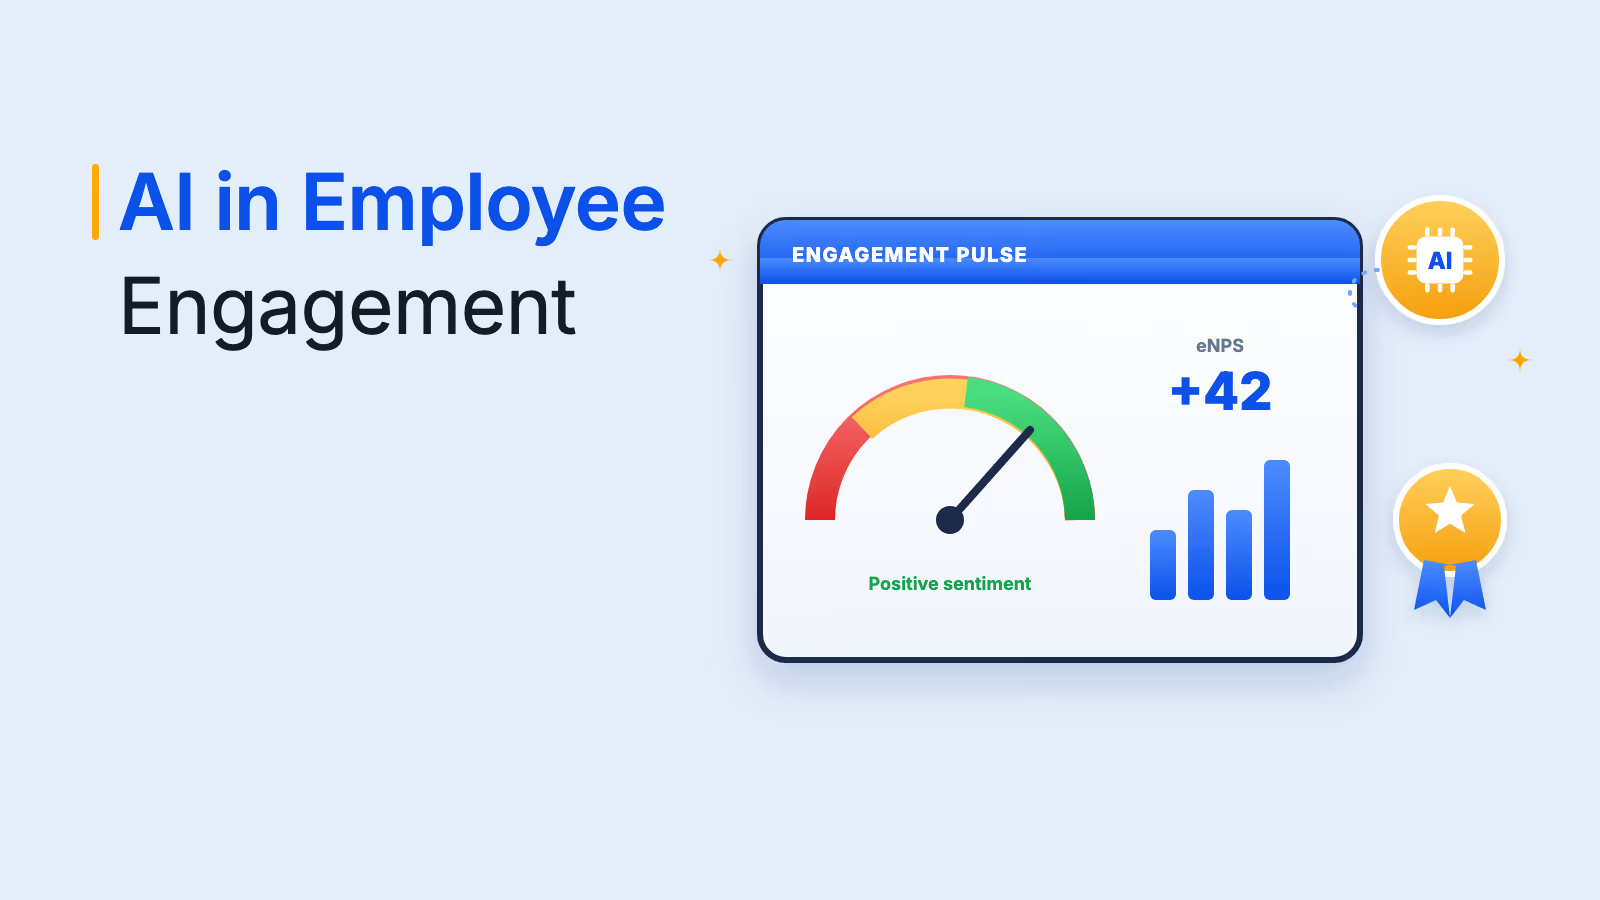
eNPS gauges employee loyalty and willingness to recommend the organization as a great workplace. It comes from one question: "On a scale of 0 to 10, how likely are you to recommend our company as a place to work to a friend or colleague?" Respondents scoring 9 to 10 are promoters, 7 to 8 are passives and 0 to 6 are detractors.
Formula: eNPS = % promoters - % detractors. A higher score, on a scale from -100 to +100, indicates better engagement and a more positive culture. For benchmarks and a survey template, read the full guide to the employee net promoter score.
2. Employee satisfaction score
Employee satisfaction is closely related to engagement. It evaluates how content employees are with their work and overall experience, including relationships with colleagues and supervisors, work-life balance, benefits and career development. Surveys usually use a Likert scale (1 to 5 or 1 to 7).
Formula: Satisfaction score = sum of all scores ÷ number of responses. Track changes over time to spot trends; the difference between satisfaction and engagement is explained in this guide to employee satisfaction.
3. Employee engagement survey score
Engagement surveys measure the overall engagement level of employees through questions on motivation, alignment with company values, manager relationships, resources and career development. Common questions include "Do you feel your work is meaningful and aligned with the company's mission?" and "Do you have the tools and resources you need to do your job well?"
Formula: Engagement score = average of favorable responses to the core engagement questions, or % of employees answering favorably (4 or 5 on a 5-point scale). Keep responses anonymous to encourage honest feedback, and see how an employee engagement index combines several drivers into one score.
4. Pulse survey score and participation
Pulse surveys are short, frequent surveys (weekly, every two weeks or monthly) on key drivers such as job satisfaction, communication, leadership and workload. Their frequency lets you track changes and respond to emerging issues quickly, such as fixing a specific problem or recognizing achievements.
Formula: Pulse score = average favorable score across pulse questions; participation rate = responses ÷ employees invited × 100. Falling participation is often the first sign that employees doubt anything will change.
5. 360-degree feedback score
360-degree feedback gathers input from the employee, peers, supervisors and direct reports to give a rounded view of strengths and development areas. Identify the competencies that matter for each role, collect feedback with standardized questions, analyze patterns and use the results for coaching and development planning.
Formula: Competency score = average rating across all raters for each competency; compare self-ratings with others' ratings to find blind spots.
6. Employee happiness index
The employee happiness index assesses overall happiness and wellbeing at work, covering job satisfaction, work environment, work-life balance and growth opportunities. Assign numerical values to the responses to a short survey and average them.
Formula: Happiness index = sum of happiness scores ÷ number of responses. A lower index points to areas where wellbeing support or workload changes are needed.
7. Employee turnover rate
Turnover rate measures the percentage of employees who leave during a period. High turnover can signal low engagement, because disengaged employees are more likely to look elsewhere. Separate voluntary from involuntary turnover, and track regretted leavers separately.
Formula: Turnover rate = employees who left ÷ average number of employees × 100. For deeper analysis of why people leave, see this guide to employee attrition and use an employee exit survey.
8. Employee retention rate
Retention rate measures the percentage of employees who stay over a period, such as a year. High retention often indicates a positive work environment and engaged employees.
Formula: Retention rate = employees at the end of the period who were also there at the start ÷ employees at the start × 100. Exclude new hires from the numerator so growth does not inflate the result.
9. Absenteeism and tardiness rate
Absenteeism measures how often and how long employees are away from work. High absence can be a sign of disengagement, burnout or dissatisfaction, and Gallup's meta-analysis links top-quartile engagement with 78% lower absenteeism.
Formula: Absenteeism rate = total days absent ÷ total possible workdays × 100. Look at unplanned absence by team, because a spike in one team is usually more telling than the company average.
10. Employee productivity metrics
Productivity measures how efficiently and effectively employees perform their roles. Engaged employees tend to be more productive because they are motivated and committed. Use the key performance indicators that fit your industry:
- Output per employee: Total output (units produced, projects completed) ÷ number of employees.
- Revenue per employee: Total revenue ÷ number of employees.
- Time to complete tasks or projects: Average time taken against plan; timely completion often reflects focus and engagement.
11. Peer recognition score
The peer recognition score measures how often employees recognize and appreciate colleagues, which reflects a collaborative, engaged culture. Track the number of peer recognitions given in a month or quarter through a recognition platform or program.
Formula: Peer recognition score = peer recognitions given ÷ total employees. Also check reach: the share of employees who received at least one recognition in the period, so that appreciation is not concentrated on a few people.
12. Internal promotion rate
This metric measures the share of senior roles filled by promoting existing employees rather than hiring externally. A high rate shows that the organization values growth and development, which lifts engagement and retention.
Formula: Internal promotion rate = internal promotions ÷ total positions filled at that level (internal and external) × 100.
13. Training and development participation rate
This metric shows how engaged employees are in their own growth. Engaged employees often seek opportunities to build skills through workshops, courses and certifications.
Formula: Training participation rate = employees who took part in training ÷ eligible employees × 100.
14. Employee referral rate
The employee referral rate measures the share of new hires referred by current employees. Engaged employees are more likely to recommend their workplace to friends, so this is the behavioral counterpart to eNPS and a sign of a strong employer brand.
Formula: Referral rate = new hires from employee referrals ÷ total new hires × 100.
Employee engagement KPI scorecard
You do not need all 14 metrics on day one, but you do need a balance of leading indicators, which warn you early, and lagging indicators, which confirm business impact. Copy this scorecard, pick six to eight employee engagement KPIs and review them on the cadence shown.
| Metric | Type | Data source | Review cadence | Red flag to watch |
|---|---|---|---|---|
| eNPS | Leading | Pulse survey | Quarterly | Below 0, or a drop of 10+ points |
| Engagement survey score | Leading | Engagement survey | Twice a year | Any driver falling two cycles in a row |
| Survey participation rate | Leading | Survey platform | Every survey | Below 60%, or one team far below the rest |
| Peer recognition reach | Leading | Recognition platform | Monthly | Under half of employees recognized in a quarter |
| Training participation rate | Leading | Learning system | Quarterly | Falling while headcount grows |
| Absenteeism rate | Lagging | HRIS or attendance | Monthly | Unplanned absence rising in one team |
| Voluntary turnover rate | Lagging | HRIS | Monthly and yearly | Regretted leavers above your target |
| Retention rate (first year) | Lagging | HRIS | Quarterly | New hires leaving within 90 days |
| Internal promotion rate | Lagging | HRIS | Yearly | Most senior roles filled externally |
| Referral rate | Lagging | Applicant tracking system | Quarterly | Referrals falling as a share of hires |
| Revenue or output per employee | Lagging | Finance or operations | Quarterly | Falling in teams with low engagement |
Review the scorecard by team, location and tenure, not just company-wide. Engagement problems are usually local, and an average can hide a team in trouble.
How to measure employee engagement ROI
Measuring employee engagement ROI shows whether a program, such as a new recognition platform or a manager training program, returned more than it cost. A widely used approach, the Phillips ROI Methodology from the ROI Institute, evaluates any HR initiative at five levels, and each level builds on the one before it.
- Level 1, reaction and planned action: Measures how employees react to the program and what they plan to do. Use adoption rates and system usage reports.
- Level 2, learning: Measures changes in knowledge and attitudes, using quizzes and short opinion surveys.
- Level 3, application: Measures changes in on-the-job behavior through surveys, observation, interviews, follow-up focus groups and action planning.
- Level 4, business impact: Captures changes in business measures such as turnover, absence, productivity or quality, through performance monitoring.
- Level 5, ROI: Compares the monetary benefits of the program with its costs.
Map engagement ROI across the program value chain
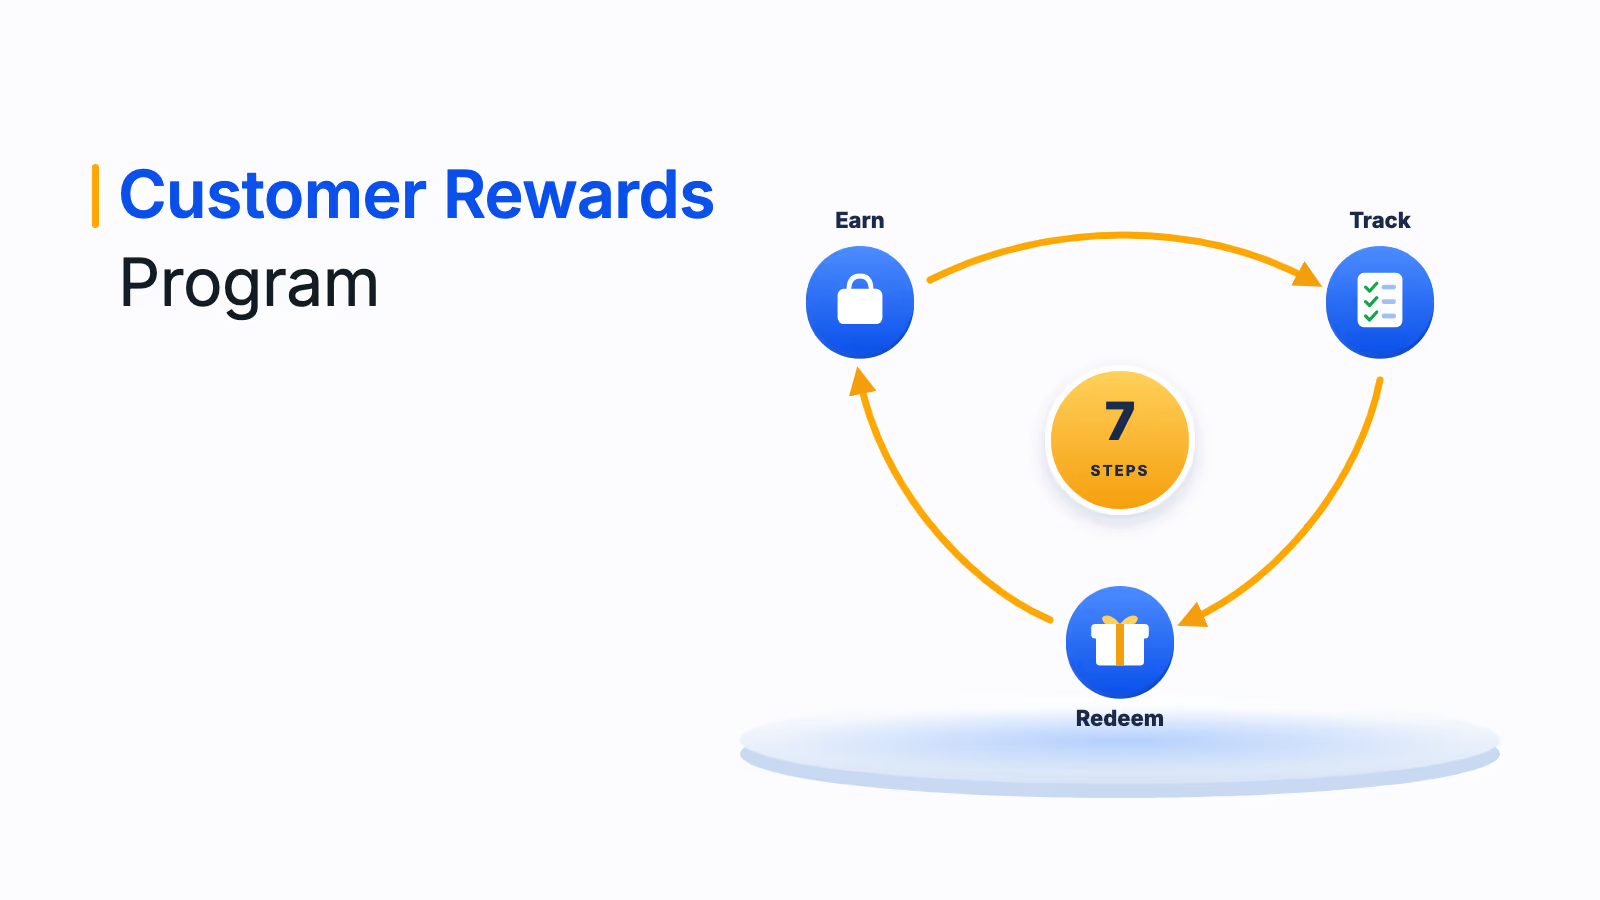
The five levels are applied at different points as a program runs. These seven steps show where each type of data is collected, from setting objectives to the final calculation.
- Set the objective: Define a clear, measurable goal, such as "reduce voluntary attrition by 2 percentage points" or "improve eNPS by 10 points".
- Plan the evaluation and capture baseline data: Build measurement in from the start, using existing data such as your last engagement survey and turnover reports.
- Collect data during implementation: Track Level 1 and Level 2 data with implementation reports, usage reports, quizzes and short opinion surveys.
- Collect data after implementation: Gather Level 3 and Level 4 data with surveys, observation, interviews, focus groups and action planning.
- Isolate the effect of the program: The strongest method is comparison group analysis: run the program in one of two similar groups and compare results such as productivity or turnover over time. Trend line analysis, forecasting and expert estimates are alternatives.
- Convert data into monetary value: Use standard values for output, quality and employee time, historical costs or expert estimates to turn each improvement into money.
- Calculate ROI: Compare net benefits with the full program cost.
Worked example: employee engagement ROI
The formula is ROI = (program benefits - program costs) ÷ program costs × 100. Here is how it works for a recognition program piloted in a division of 1,000 employees, with a similar division of the same size as the comparison group:
| Item | Value | How it is calculated |
|---|---|---|
| Program cost for the year | $300,000 | Platform, rewards budget and admin time |
| Fewer voluntary leavers than the comparison group | 16 people | Pilot turnover 14% vs 15.6% in the comparison division, across 1,000 employees |
| Replacement cost per leaver (your own figure) | $20,000 | Recruiting, onboarding and lost productivity, from your HR and finance data |
| Retention benefit | $320,000 | 16 × $20,000 |
| Productivity and absence benefit | $80,000 | Fewer absence days × daily cost per employee |
| Total benefits | $400,000 | $320,000 + $80,000 |
| ROI | 33% | ($400,000 - $300,000) ÷ $300,000 × 100 |
Use your own replacement and absence costs rather than published averages; finance teams trust numbers they recognize. For a rewards-specific version of this calculation, see employee rewarding ROI, and for experience programs, read measuring employee experience.
Best practices for measuring engagement program success
Business owners expect HR to show how engagement programs contribute to performance and ROI. These ten best practices, ordered from setting goals to keeping the program simple, make that case easier to prove.
- Define your program goals: If employees do not understand the company's goals, incentivizing them is useless. Start with the corporate mission, then department objectives, then team and individual goals, so people see the impact of their work.
- Set up focus groups: When a few yes or no questions are not enough, invite a small group of employees to discuss how the program is going and what would make it better.
- Align the program with business goals: Run correlations between program, culture and business data. In a sales team, for example, product quizzes with small incentives keep knowledge sharp, and tiered rewards that grow at higher milestones lift volume.
- Break out of the mold: Automatic year-end cash bonuses quickly become expected and are not tied to measurable actions, so they rarely change behavior.
- Combine program metrics with business metrics: Program metrics (usage, adoption, frequency, reach) show what is happening; business metrics (retention, productivity, customer satisfaction, profit) show what it achieved.
- Track engagement patterns: Ask who is recognized often, who is not recognized at all, which managers rarely recognize their teams and where low engagement may point to a training need.
- Watch turnover levels: If retention improves alongside the program, especially compared with similar teams, the program is likely contributing.
- Check the bottom line: Profit and ROI are blunt indicators on their own, but combined with comparison groups they show direction.
- Re-evaluate the data every quarter: Reorganizations, growth and changing workforces mean the strategy that worked last year may not work now. Quarterly reviews let you challenge assumptions and adjust.
- Keep program workflows simple: A program that is easy to use gets used, and only a used program produces data. Make it open to all employees, including managers, with real-time dashboards and on-demand reports.
Measurement only pays off if it leads to action. Once you know where engagement is weak, build an employee engagement action plan for the teams that need it most.
How Empuls helps you measure and improve employee engagement
Measuring employee engagement is not just about an annual survey. It takes continuous feedback, real-time data and action, and Empuls brings those together. Pulse surveys pair eNPS with 15 questions across four engagement drivers, delivered through Slack, Microsoft Teams or email with automatic reminders, and lifecycle surveys are scheduled to milestones from onboarding to exit and kept in sync with your HRIS.
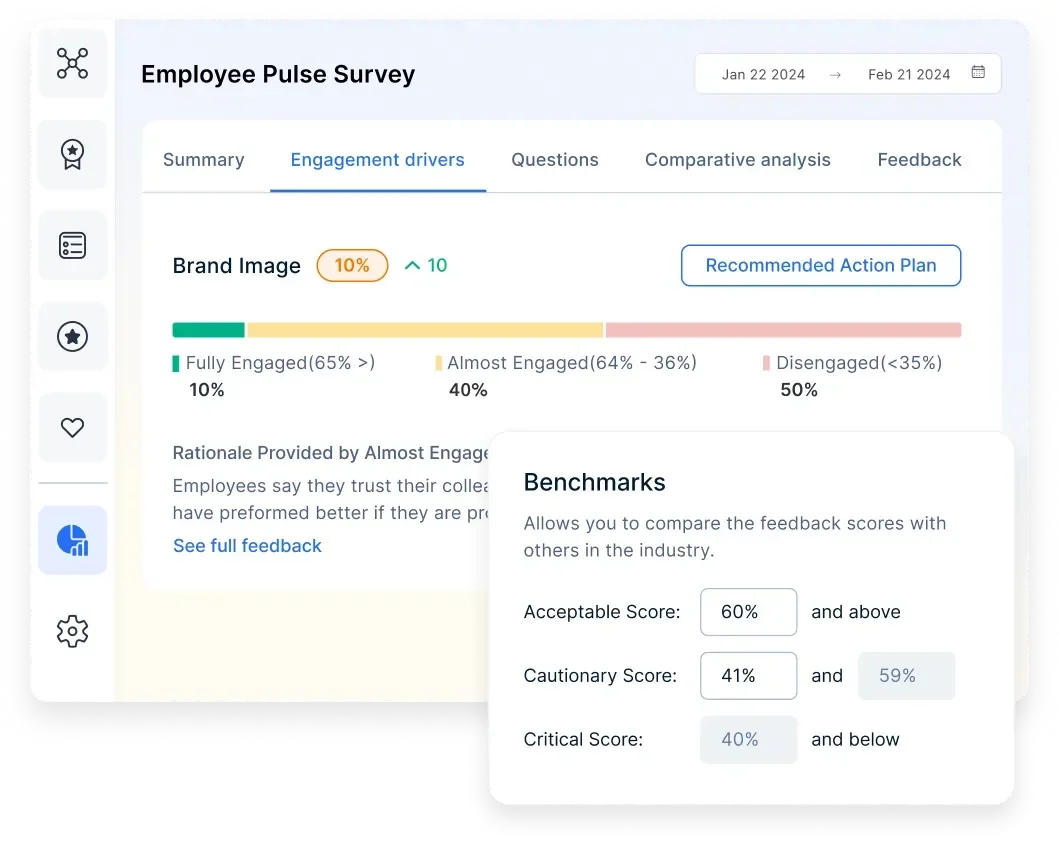
Results are sliced by department, tenure and location and benchmarked against cross-industry norms. AI sentiment analysis groups open comments into themes, and action plans assign each insight an owner and a deadline. On the behavior side, reports and analytics track recognition, rewards and redemptions in one place, so you can connect what employees say with what they do.
Measure what matters, then act on it
Engagement programs do not succeed overnight. They are built through trial, refinement and adaptation, and what works in one business may fall flat in another. That is why measurement is non-negotiable: if you are not tracking progress, you are guessing.
Start with a handful of metrics, set a baseline, review them by team every quarter and link at least one program to a business outcome with an ROI calculation. To raise your scores once you have measured them, read how to improve employee engagement and how to increase employee NPS.
Book your Empuls demo
Frequently asked questions
The best way to measure employee engagement is to combine a regular engagement survey with short pulse surveys or eNPS and a few behavioral metrics such as turnover, absenteeism and referrals. Surveys tell you how people feel and why, while behavioral data confirms whether that sentiment shows up in what they do. Review both by team every quarter.
The three types of employee engagement are usually described as cognitive, emotional and physical. Cognitive engagement is how focused and absorbed people are in their work, emotional engagement is how connected they feel to the organization and colleagues, and physical engagement is the energy and effort they put in. Good surveys include questions on all three.
To calculate an employee engagement score, ask a set of core engagement questions on a 5-point agreement scale, then report either the average score or the percentage of favorable answers (4 or 5). For example, if 640 of 1,000 answers are favorable, the engagement score is 64%. Keep the questions identical each cycle so trends are comparable.
Run a full engagement survey once or twice a year and short pulse surveys monthly or quarterly in between. Behavioral metrics such as turnover and absenteeism can be reviewed monthly. The right cadence is one where you can act on results before the next survey; measuring more often than you act lowers participation.
A good employee engagement score depends on the survey method, but many organizations treat 70% or more favorable responses as strong and below 50% as a concern. Gallup's 2026 global data puts the share of engaged employees at just 20%, using a stricter definition. Compare your score with your own history and with benchmarks from the same survey provider.
Engagement metrics are any measures you track, such as eNPS, absenteeism or recognition frequency. Engagement KPIs are the few metrics you have tied to a specific goal and target, such as "raise eNPS from +12 to +20 this year" or "cut first-year attrition to 10%". Track many metrics, but report a handful of KPIs to leadership.
You can estimate engagement without a survey by tracking behavior, such as turnover, absenteeism, productivity, internal promotions, training participation, referrals and recognition activity. These show what people do but not why. Most organizations still need at least a short survey or eNPS question to understand the reasons behind the numbers and decide what to fix.
To prove the ROI of an engagement program, set a measurable goal, record a baseline, run the program in a pilot group alongside a similar comparison group and convert the difference in outcomes, such as fewer leavers or fewer absence days, into money. Then apply the formula: (benefits minus costs) divided by costs, times 100.