Key Takeaways
CLV measures profit, not revenue. Most published figures omit cost to serve, which inflates the number and justifies spending that does not pay back.
Run both models: historical for reporting and finance, predictive for deciding where to spend. A large gap between them is a signal, not an error.
Extending customer lifespan has the largest effect, because it multiplies every other input. Raising frequency is the fastest.
Reducing cost to serve is the most under-used lever, and often easier than lifting average order value by a few percent.
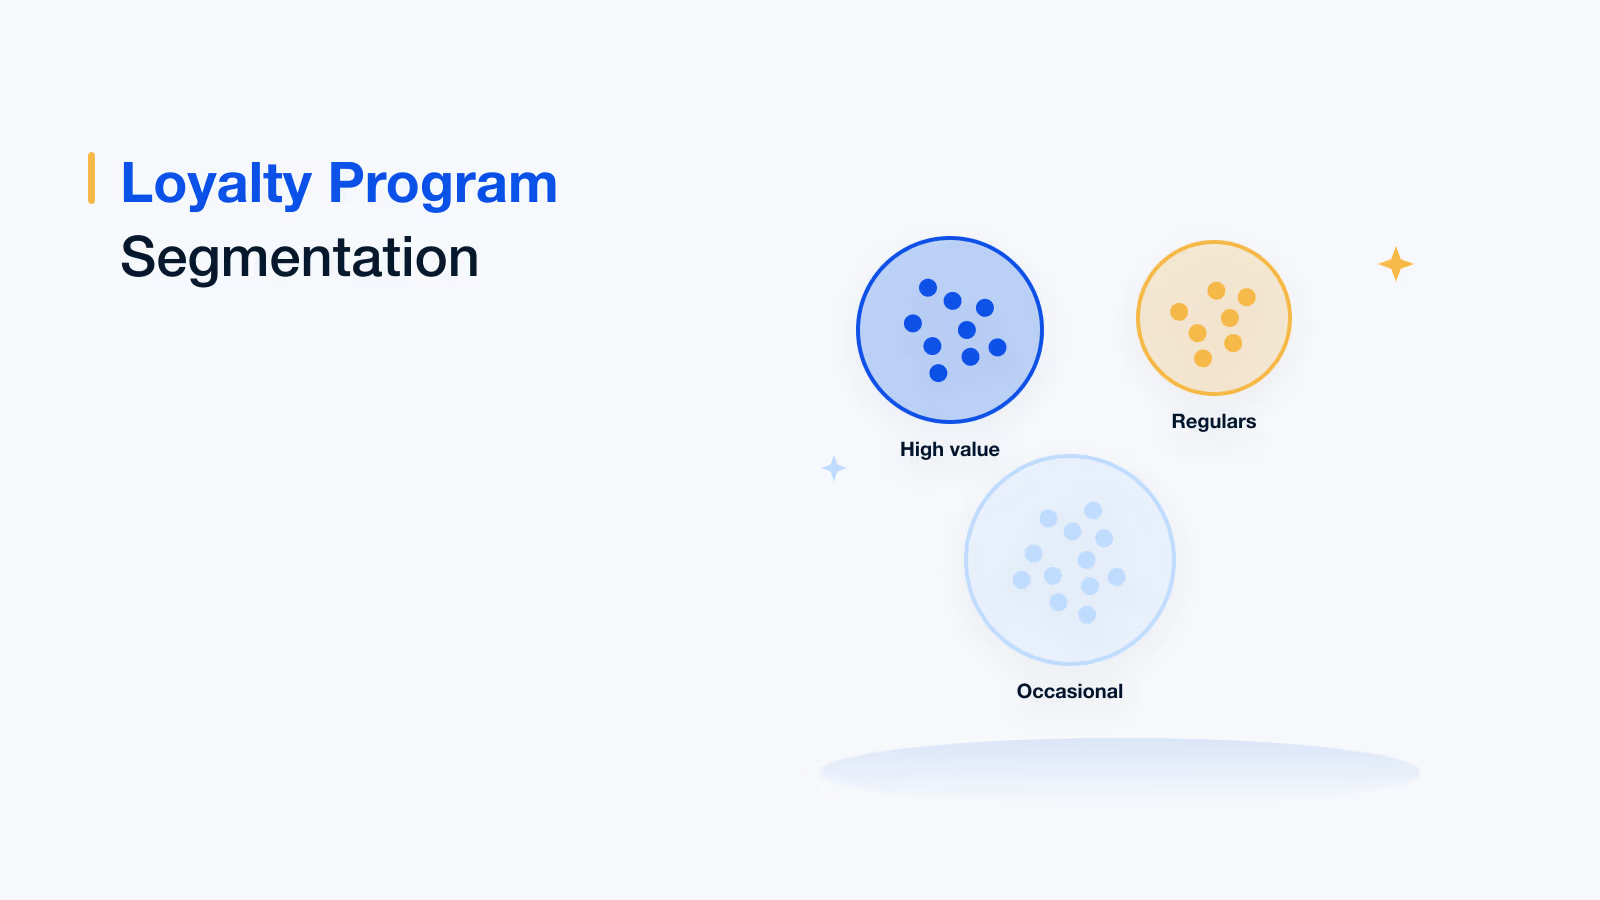
Calculate per segment. One blended average hides a spread that is usually an order of magnitude between top and bottom decile.
Customer lifetime value is the number that decides how much you can sensibly spend to acquire and keep someone. Get it wrong and every downstream decision inherits the error: acquisition budgets, retention offers, which segments get attention and which quietly get neglected.
Most published CLV figures are wrong in the same direction, because they omit the cost to serve. That produces a flattering number, and flattering numbers justify spending that does not pay back.
This guide covers the two models, how to calculate each, what actually moves CLV, and the mistakes that make the figure unusable. For the metrics around it, see our guide to customer loyalty analytics.
What CLV actually measures
CLV is the total profit you expect from a customer across the whole relationship, not the revenue. The distinction matters: a high-revenue customer who needs constant support and returns half their orders can be worth less than a quiet, lower-spending one.
2
Models
historical and predictive
4
Inputs that drive it
value, frequency, lifespan, cost
1
Term most people omit
cost to serve
The two CLV models
| Model | What it does | Use it when |
|---|---|---|
| Historical | Sums actual past profit per customer to date | You have clean transaction history and want a defensible, auditable figure |
| Predictive | Forecasts future value from behaviour patterns | You need to act on new customers before their history exists |
Historical CLV is accurate about the past and silent about the future. It will not tell you that a customer's purchase frequency halved last quarter. Predictive CLV will, but it inherits every bias in the data it learned from.
The practical answer is to run both: historical for reporting and finance, predictive for deciding where to spend. Treat a large divergence between them as a signal worth investigating rather than a modelling error to smooth away.
How to calculate CLV
The standard formula is simple enough to compute in a spreadsheet:
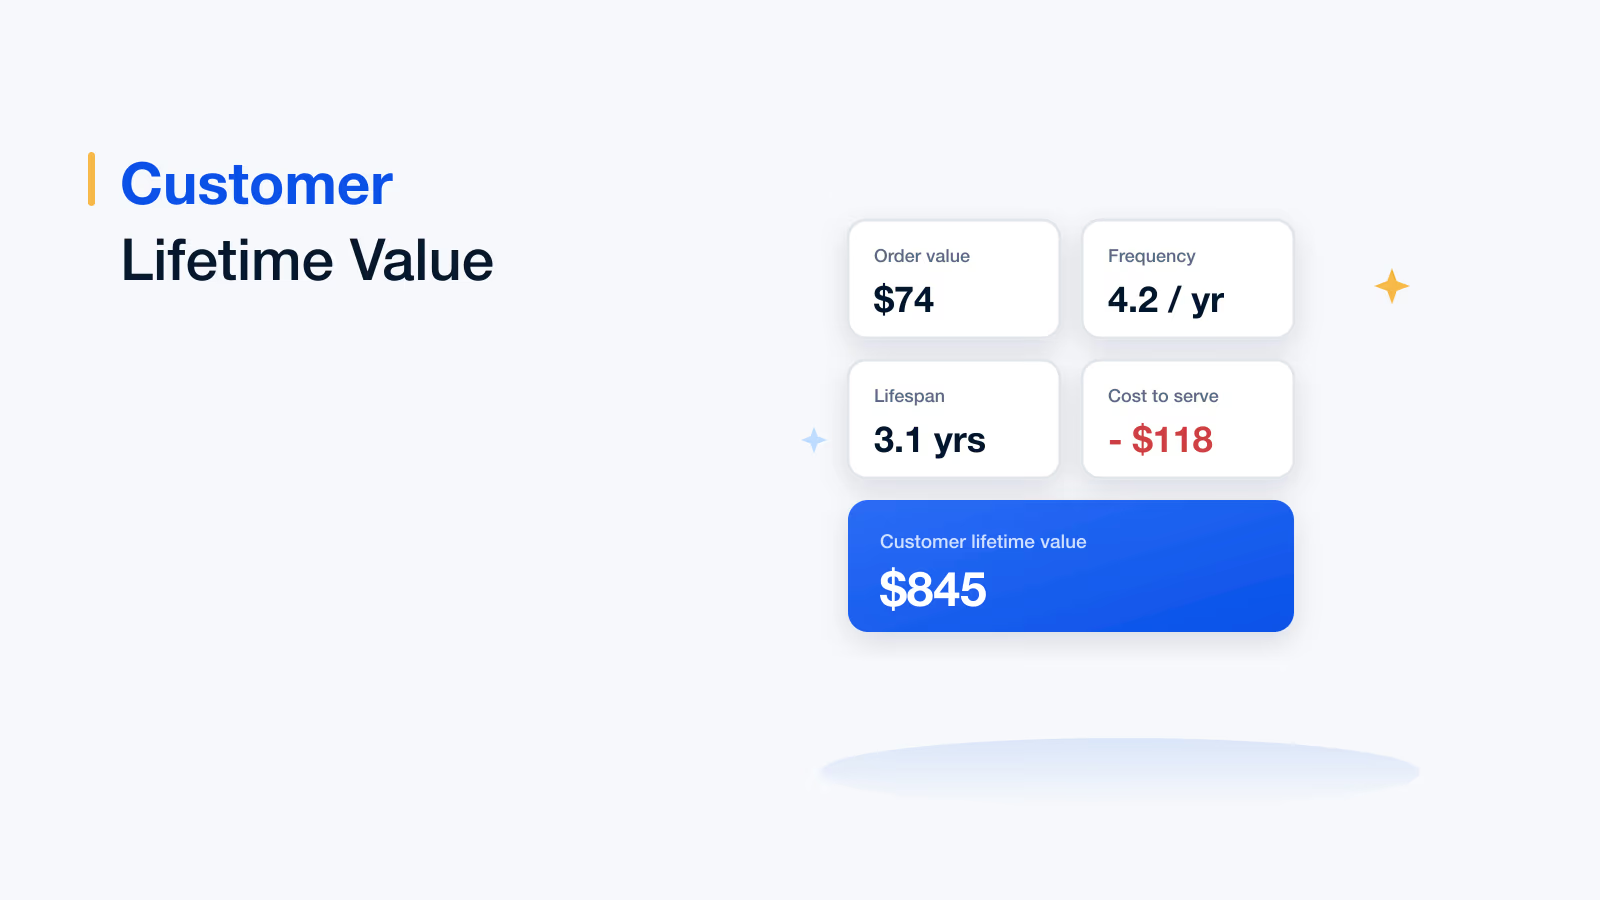
- Average order value (AOV): Total revenue divided by number of orders, over a defined period.
- Purchase frequency: Number of orders divided by number of unique customers, over the same period.
- Customer value: AOV multiplied by purchase frequency. This is annual revenue per customer.
- Customer lifespan: The average length of the relationship, in the same time unit. Derive it from your actual churn rate rather than assuming.
- Gross margin: Apply it, or you are calculating lifetime revenue and calling it value.
- Cost to serve: Subtract support, returns, shipping and servicing. This is the term most calculations skip.
Put together: CLV = (AOV x purchase frequency x lifespan x gross margin) − cost to serve. If your figure does not subtract the last term, say so when you present it, because someone will eventually build a budget on it.
Two refinements worth adding once the basic figure is stable. Discount future value, since money two years out is worth less than money now. And calculate per segment rather than as one blended average, because a single company-wide CLV almost always conceals a wide spread.
See CLV per member, not as an average
Historical and predicted value by segment, with reward liability counted against it.
Book a demoTrusted by 5,000+ companies
What actually moves CLV
| Lever | Effect on CLV | Typical difficulty |
|---|---|---|
| Increase purchase frequency | Direct and compounding; usually the fastest lever | Moderate - needs a reason to return sooner |
| Extend customer lifespan | The largest effect, since it multiplies everything else | Hard - this is retention, and it is slow |
| Raise average order value | Direct but bounded by category norms | Moderate - bundling, cross-sell, tiering |
| Improve gross margin | Direct, and often overlooked by marketing teams | Hard - usually outside the programme's control |
| Reduce cost to serve | Direct, and frequently the easiest win available | Easier than it looks - self-service, fewer returns |
| Reduce acquisition cost | Does not change CLV, changes the ratio that matters | Moderate - referrals are the cheapest channel |
The under-used lever is cost to serve. Programmes spend months trying to lift average order value by a few percent while a reduction in returns or support contacts would deliver more, faster, and without asking the customer for anything.
How engagement feeds CLV
Engagement is not a goal in itself; it matters because it precedes the behaviours that make CLV rise.
- Engagement predicts frequency: Members who interact between purchases buy sooner than those who do not. The interaction is the leading indicator.
- Engagement extends lifespan: A customer with an active relationship takes longer to drift, which is the lever with the largest CLV effect.
- Engaged members redeem: And redemption, not issuance, is the moment the programme delivers value and the liability clears.
- Engaged members refer: Referred customers typically arrive with lower acquisition cost and higher retention, which improves the ratio at both ends.
- Disengagement is the earliest churn signal: It shows up months before spend declines, which is the window where intervention still works.
What a loyalty programme does to CLV
A loyalty programme acts on three of the four inputs, and it is worth being precise about which.
- Frequency: Points, streaks and threshold mechanics give members a reason to return sooner. This is the effect most programmes actually produce.
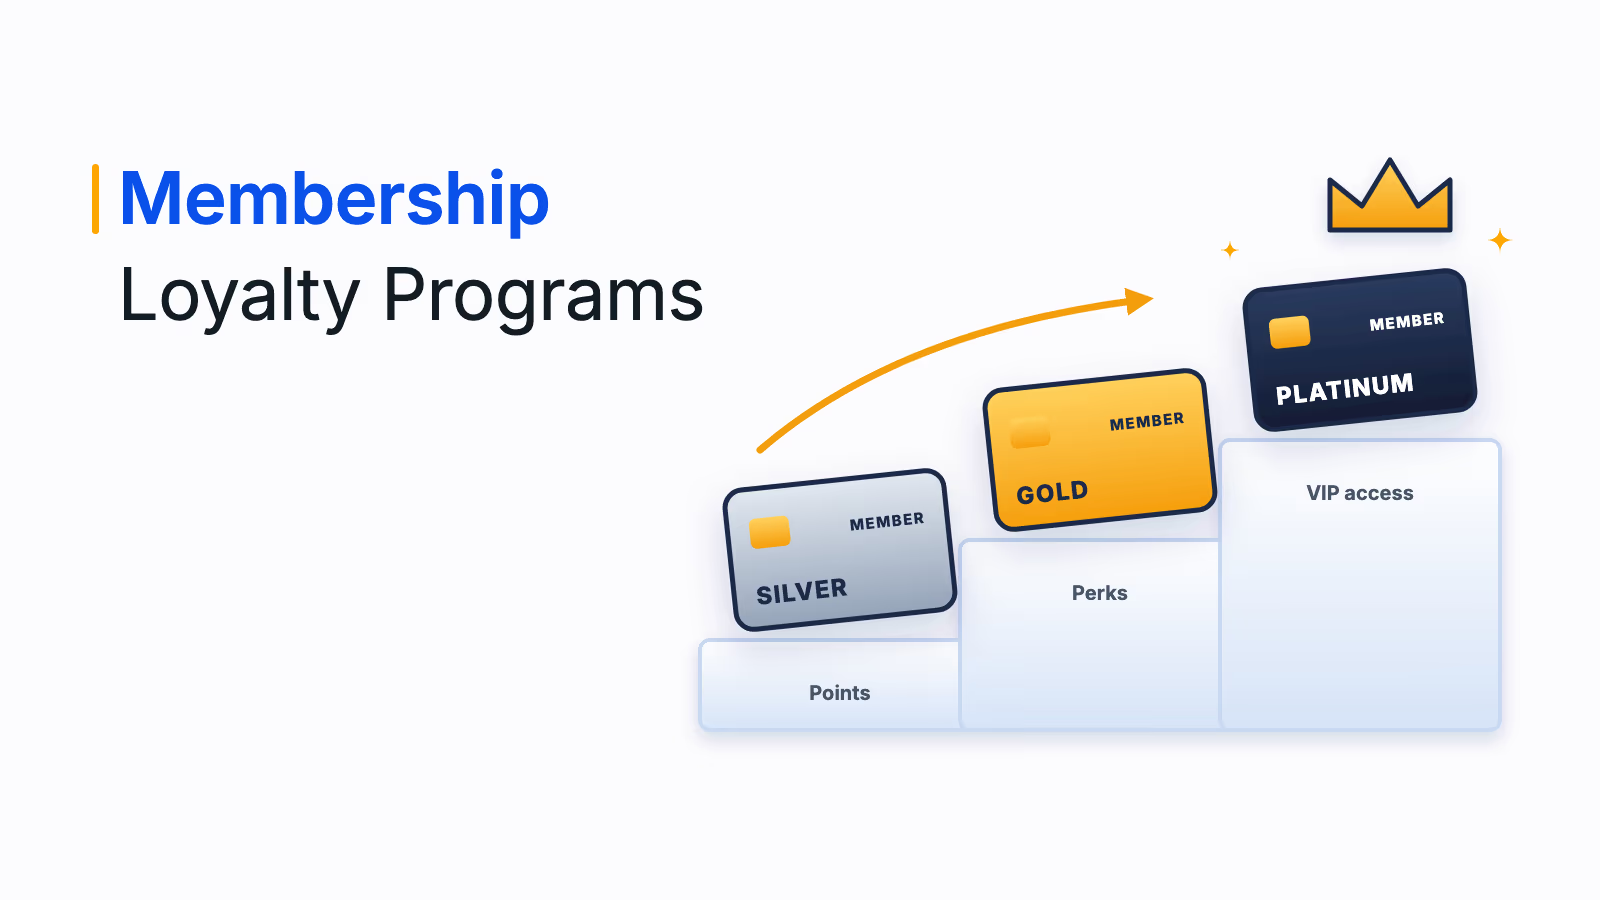
- Lifespan: Tiers and accumulated status raise the cost of leaving. A member with a balance and a status they would forfeit behaves differently from one with neither.
- Order value: Threshold rewards and tier qualification nudge basket size upward around the boundary.
- Margin: Here a programme usually works against you, since rewards are a cost. This is why redemption liability belongs in the CLV calculation rather than beside it.
The honest test of a programme is whether members' CLV exceeds that of a comparable non-member cohort by more than the programme costs. Without that comparison you are measuring the fact that loyal customers join loyalty programmes.
Where CLV calculations go wrong
- Omitting cost to serve: The most common error, and it always inflates the figure.
- Using revenue instead of margin: Produces a number that looks impressive and cannot be spent.
- One blended average: Hides the spread entirely. The useful figure is per segment, where the difference between the top and bottom decile is usually an order of magnitude.
- Assuming lifespan: Deriving it from a guess rather than from your actual churn rate. Lifespan multiplies everything else, so an error here scales.
- Ignoring the discount rate: Treating revenue three years out as equal to revenue today overstates long-horizon customers.
- Treating it as fixed: CLV is a forecast that changes with behaviour. A figure calculated once and reused for two years is a historical artefact.
- Comparing CLV without CAC: CLV alone says nothing about whether the business works. The ratio to acquisition cost is the number that matters.
Measure and improve CLV with Loyalife
01 · Measure
CLV per member and segment
Historical and predicted value calculated per member, so the spread is visible rather than hidden in an average.
02 · Frequency
Mechanics that pull purchases forward
Points, thresholds and challenges that give members a reason to return sooner, which is the fastest CLV lever.
03 · Lifespan
Tiers and status that raise switching cost
Accumulated balance and status that a member would forfeit, which is the lever with the largest effect.
04 · Predict
Churn scoring on high-value members
Risk flagged with reasons, prioritised by predicted value so retention effort follows the money.
05 · Cost
Liability tracked against value
Reward cost and outstanding points measured per segment, so CLV is net rather than notional.
06 · Prove
Member versus non-member cohorts
Control groups and cohort reporting, so the programme's CLV effect is demonstrated rather than assumed.
You can also explore the Loyalife platform and member profile and segmentation.
If you do one thing with this: recalculate your CLV with cost to serve subtracted and broken out by segment. The number will be lower and the distribution wider than the version currently in your deck, and both facts are useful.
Book your Loyalife demo
Frequently asked questions
The standard formula is average order value multiplied by purchase frequency, multiplied by expected customer lifespan, multiplied by gross margin, less the cost to serve. Average order value is revenue divided by orders. Purchase frequency is orders divided by unique customers. Lifespan should be derived from your actual churn rate rather than assumed. Omitting the cost-to-serve term is the most common error.
Historical CLV sums actual past profit per customer, which makes it accurate, auditable and completely silent about the future. Predictive CLV forecasts future value from behaviour patterns, which lets you act on new customers before their history exists, but it inherits any bias in the training data. Most organisations should run both.
Because CLV is meant to measure profit, not revenue. A high-revenue customer who generates constant support contacts and returns a large share of orders can be worth less than a quieter, lower-spending one. Leaving out support, returns, shipping and servicing produces a flattering figure, and flattering figures justify acquisition and retention spend that never pays back.
Increasing purchase frequency, because the effect is direct and compounds. Extending customer lifespan has a larger effect overall, since it multiplies every other input, but it is slower because it is retention work. The most under-used lever is reducing cost to serve, which often delivers more than a few percentage points on average order value and does not require anything from the customer.
It acts on three of the four inputs. Points and threshold mechanics raise purchase frequency, tiers and accumulated status extend lifespan by making leaving costlier, and threshold rewards nudge order value around the boundary. On margin a programme usually works against you, since rewards are a real cost, which is why redemption liability belongs inside the CLV calculation.
CLV alone tells you nothing about whether the business works; the ratio to customer acquisition cost is what matters. Rather than aiming at a figure quoted for another sector, track your own ratio by segment and by acquisition channel over time. A ratio that is healthy in aggregate can conceal channels that never pay back.
Often enough that it reflects current behaviour, which for most businesses means quarterly at minimum. CLV is a forecast, not a fixed attribute, and a figure calculated once and reused for two years is a historical artefact being used to make forward decisions. Recalculate per segment, and treat large movements as something to investigate.
Yes. A single blended company-wide figure almost always conceals a spread of an order of magnitude between the top and bottom deciles. Acting on the average means over-investing in low-value customers and under-investing in high-value ones simultaneously. Segment-level CLV is what makes the number usable for budget decisions.