Key Takeaways
Employee net promoter score (eNPS) is the percentage of promoters (9 to 10) minus the percentage of detractors (0 to 6) on one 0 to 10 question about recommending your workplace.
eNPS ranges from -100 to +100; +10 to +30 is generally good, above +50 is excellent and below zero needs immediate action.
BambooHR's 2026 data puts the average eNPS at 40, with industry averages ranging from 34 in restaurants to 51 in construction.
eNPS tells you what employees feel but not why, so pair it with an open follow-up and a few driver questions.
Small samples swing widely, so check the margin of error and report only groups of five or more before reacting to a change.
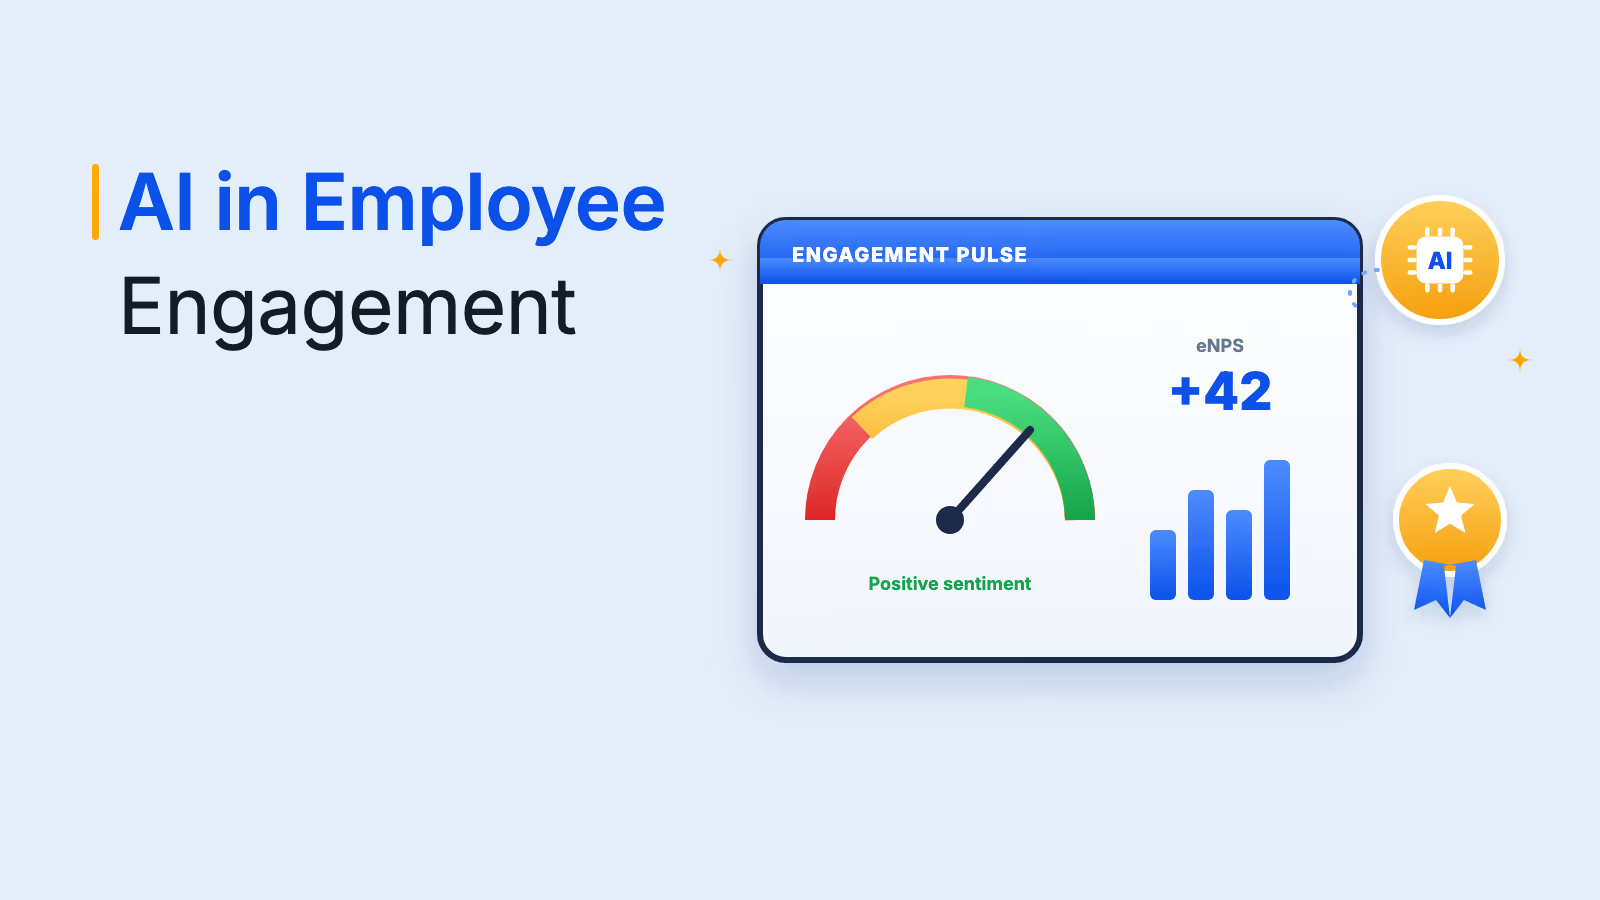
The employee net promoter score (eNPS) is a single number, from -100 to +100, that shows how likely your employees are to recommend your company as a place to work. You get it by asking one 0 to 10 question and subtracting the share of detractors from the share of promoters. It is quick to run, easy to trend and, paired with one or two follow-up questions, one of the clearest early signals of loyalty and attrition risk.
"To win in the marketplace, you must first win in the workplace," said Doug Conant, former CEO of Campbell's Soup. Engaged employees drive innovation, strengthen customer relationships and fuel long-term growth, but you cannot manage engagement on gut feel. This guide covers what eNPS is, how to calculate it with a worked example, what a good score looks like against 2026 benchmarks, a ready-to-use eNPS survey template and how to turn the results into action.
eNPS meaning: one question, three groups of employees
Employee net promoter score is an adaptation of the customer Net Promoter Score, used to measure employee loyalty and advocacy instead of customer loyalty. If you are asking what is eNPS in one line: it is the percentage of employees who would actively recommend your workplace minus the percentage who would not. Every eNPS survey is built around one question:
Responses fall into three groups:
- Promoters (9 to 10): Enthusiastic supporters who are likely to recommend the company and speak well of it inside and outside work.
- Passives (7 to 8): Satisfied but unenthusiastic employees. They are not counted in the score, but they are the most open to offers from competitors.
- Detractors (0 to 6): Unhappy employees who may negatively influence others and harm the company's reputation as an employer.
The simplicity and clarity of eNPS make it a valuable tool for measuring engagement. It gives a clear snapshot of employee sentiment, so you can quickly see where something needs attention and track whether your workplace initiatives move the number over time. It is not a full engagement measure on its own, which is why the best programs pair it with a short set of driver questions, covered in the template below.
How to calculate eNPS with a worked example
To calculate eNPS, subtract the percentage of detractors from the percentage of promoters. Passives count toward the total number of responses but not toward either group, so the formula is:
Here is how to calculate eNPS for a company of 200 people where 160 employees answered the survey, an 80% response rate:
| Group | Score range | Responses | Share of responses |
|---|---|---|---|
| Promoters | 9 to 10 | 72 | 45% |
| Passives | 7 to 8 | 56 | 35% |
| Detractors | 0 to 6 | 32 | 20% |
| Total | 0 to 10 | 160 | 100% |
| eNPS | 45 - 20 = +25 |
Since eNPS results can vary based on when and how the question is asked, keep the wording, scale and timing the same every time. Companies gather feedback monthly, quarterly or twice a year, and the trend across cycles tells you more than any single reading.
One step most guides skip is checking whether a change is real. In the example above, the statistical margin of error at 95% confidence is roughly plus or minus 12 points, because a small survey swings more than a large one. A move from +25 to +29 next quarter could be noise, while a move to +40 is a genuine shift. Larger response counts narrow the margin, which is one more reason to push participation up.
Good eNPS score benchmarks for 2026
A good eNPS score is any positive score that is rising over time, and most practitioners treat +10 to +30 as good, +30 to +50 as very good and anything above +50 as excellent. Anything below zero means detractors outnumber promoters and needs immediate attention.
Benchmarks help put your number in context. The BambooHR 2026 Employee Happiness Index, built on more than 2.5 million eNPS responses from over 1,400 companies, put the average eNPS at 40 in the first half of 2026, the strongest first half since 2023. Scores vary a lot by industry:
| Industry | eNPS, H1 2025 | eNPS, H1 2026 |
|---|---|---|
| Construction | 53 | 51 |
| Finance | 42 | 47 |
| Healthcare | 35 | 40 |
| Education | 38 | 39 |
| Travel and hospitality | 40 | 39 |
| Nonprofits | 35 | 38 |
| Technology | 38 | 37 |
| Restaurant, food and beverage | 32 | 34 |
The same dataset shows why the score matters: companies with an excellent eNPS lose 46% fewer employees than companies with a negative eNPS, and employees with two to three years of tenure score lowest, at 33, compared with 51 for new hires. Use the table below to read your own result.
| eNPS range | What it usually means | What to do next |
|---|---|---|
| Below 0 | More detractors than promoters; high attrition risk | Read every comment, find the top two issues and act within weeks |
| 0 to +10 | Fragile; many passives who could leave | Segment by team and fix the weakest areas first |
| +10 to +30 | Good, healthy baseline | Protect what works and target lagging teams |
| +30 to +50 | Very good; strong advocacy | Compare with your industry average and keep the trend rising |
| Above +50 | Excellent; employees actively recommend you | Use promoters in referrals and employer branding |
Compare yourself with your own history first and an industry average second. Survey methods differ between benchmark providers, so treat any external figure as a rough guide rather than a target.
Run eNPS pulses that explain the score
Pair every eNPS question with driver scores and AI-read comments, sliced by team.
Talk to our ExpertTrusted by 5,000+ companies
Benefits of employee net promoter score
Tracking employee sentiment is not just about keeping your workforce happy. It directly affects business performance, and eNPS gives you five practical advantages over relying on assumptions:
- Clear measurement of employee engagement: Many companies struggle to gauge how engaged their workforce truly is. eNPS simplifies this with one straightforward metric. A high score points to a motivated, satisfied workforce, and a low score highlights areas that need improvement.
- Improved employee retention: A strong eNPS signals a workplace where employees feel valued and heard. Organizations that track and act on it spot flight risk earlier, which reduces hiring costs and keeps experienced people in place.
- Higher productivity and performance: Engaged employees contribute more, work efficiently and are more committed to business goals. Global engagement fell to 20% in 2025, according to Gallup's State of the Global Workplace 2026, which estimates that low engagement costs the world economy about $10 trillion in lost productivity.
- Data-driven decision making: Instead of relying on assumptions, eNPS gives HR and leadership a trend line they can act on, so changes to culture, benefits and management practices are based on evidence.
- Stronger employer brand: A high eNPS means employees are more likely to recommend the company as a great place to work. That strengthens your reputation and your referral pipeline in a competitive job market.
Even the act of running a regular eNPS survey sends a signal that management is listening and willing to act on feedback. That perception only holds if employees see something change afterward.
Limitations of eNPS to plan around
eNPS is a strong headline metric but a weak diagnostic one. These four limitations are the reason most organizations combine it with follow-up and driver questions rather than running it alone:
- It tells you what, not why: A score of +12 does not explain itself. Without an open-ended follow-up or driver questions, you know there is a problem but not where.
- Passives disappear from the math: A team that moves from 40% passives to 40% detractors sees a big drop, but a team that moves from 40% promoters to 40% passives can look stable for a while even as enthusiasm fades.
- Small groups distort results: A team of eight can swing 25 points because one person changed their answer. Report only groups above a minimum size, commonly five or more respondents, to protect both accuracy and anonymity.
- Culture affects the scale: In some regions people rarely give a 9 or 10 to anything, so compare countries with their own history rather than with each other.
eNPS vs employee engagement survey
eNPS and a full engagement survey answer different questions, and most organizations need both. The table shows where each fits.
| eNPS | Employee engagement survey | |
|---|---|---|
| What it measures | Loyalty and willingness to recommend the employer | Engagement drivers such as manager support, growth, recognition, workload and purpose |
| Length | 1 question plus 1 or 2 follow-ups | Usually 20 to 60 questions |
| Time to complete | Under a minute | 10 to 20 minutes |
| Best frequency | Monthly or quarterly | Once or twice a year, with pulses in between |
| Output | One trendable score from -100 to +100 | Scores by driver, team and theme |
| Best used for | Early warning and trend tracking | Diagnosing root causes and planning action |
To build the fuller picture, see this guide to the employee engagement survey, how an employee engagement index combines several drivers into one score and the wider list of employee survey types. If your annual survey is not producing change, read why annual employee surveys fail.
eNPS survey template: questions to ask
A useful eNPS survey has three parts: the core question, one or two open follow-ups and a short set of driver questions that explain the score. Keep the whole survey under five minutes; the driver questions are optional on monthly pulses but worth adding at least once a quarter.
| Part | Question | Answer format |
|---|---|---|
| Core | On a scale of 0 to 10, how likely are you to recommend [company] as a place to work to a friend or colleague? | 0 to 10 scale (required) |
| Follow-up | What is the main reason for your score? | Open text |
| Follow-up | What is one thing we could change that would make you more likely to recommend us? | Open text |
| Driver: manager | My manager gives me regular, useful feedback. | 5-point agree scale |
| Driver: growth | I can see a path to grow my career here. | 5-point agree scale |
| Driver: recognition | I am recognized when I do good work. | 5-point agree scale |
| Driver: workload | My workload is manageable most weeks. | 5-point agree scale |
| Driver: purpose | I understand how my work contributes to the company's goals. | 5-point agree scale |
| Driver: voice | I believe leadership will act on the results of this survey. | 5-point agree scale |
Some teams also ask a second loyalty question about the product, such as "How likely are you to recommend our products or services to a friend?" Keep it separate from the workplace score so the two are never blended. For more question ideas by topic, see these employee feedback examples.
How to run an eNPS survey in 6 steps
Implementing eNPS takes a structured approach so the insights are accurate and lead to action. The six steps below run in order, and the last one, acting on feedback, matters most because it decides whether people answer honestly next time.
- Design the survey: Use the core question exactly as written in the template, then add an open follow-up such as "What is the primary reason for your score?" or "What improvements would enhance your experience?"
- Select the right questions: Keep extra questions easy to understand and focused on key engagement drivers such as job satisfaction, work environment, leadership and career growth opportunities.
- Choose the right survey frequency: Run eNPS at regular intervals, monthly or quarterly as a pulse survey or at least twice a year, to monitor trends while avoiding survey fatigue. Surveying too often without visible action lowers participation and honesty.
- Encourage honest and constructive feedback: Anonymity is key to candid responses. Tell employees how their answers are protected, who sees the results and at what group size, and what the survey is for.
- Analyze the results: Go beyond the headline score. Break the data down by department, location, tenure and job level to uncover issues that need attention.
- Act on feedback and drive change: Build action plans for the main concerns, share what you heard and what you will do, and follow up before the next survey so employees see that their voices matter.
How to analyze eNPS results
Once the survey closes, analysis turns a single number into a set of priorities. Work through these six steps in order, starting with the score and ending with a shared discussion of what to do.
- Calculate the eNPS score: Subtract the percentage of detractors from the percentage of promoters. For example, if 60% of employees are promoters and 20% are detractors, the eNPS is +40.
- Identify trends and patterns: Look for common themes in the responses. If detractors often mention a lack of career development while promoters praise the collaborative environment, you know where to focus.
- Segment the data: Break results down by department, job level or location to reveal challenges within specific groups. If the sales team scores far lower than marketing, the issue may sit with that team's workload or management style.
- Evaluate open-ended responses: Comments give context the numbers cannot. A response might reveal that employees feel overworked during peak seasons, which points to better resource planning or extra hiring for busy periods.
- Benchmark against previous results: Compare the current score with past cycles and check the margin of error before celebrating or worrying. A rise from +20 to +35 over a year on a large sample suggests your engagement efforts are working.
- Share and discuss findings: Present the results to leadership and managers, then to employees. A town hall followed by team breakout sessions works well for agreeing on specific areas to improve.
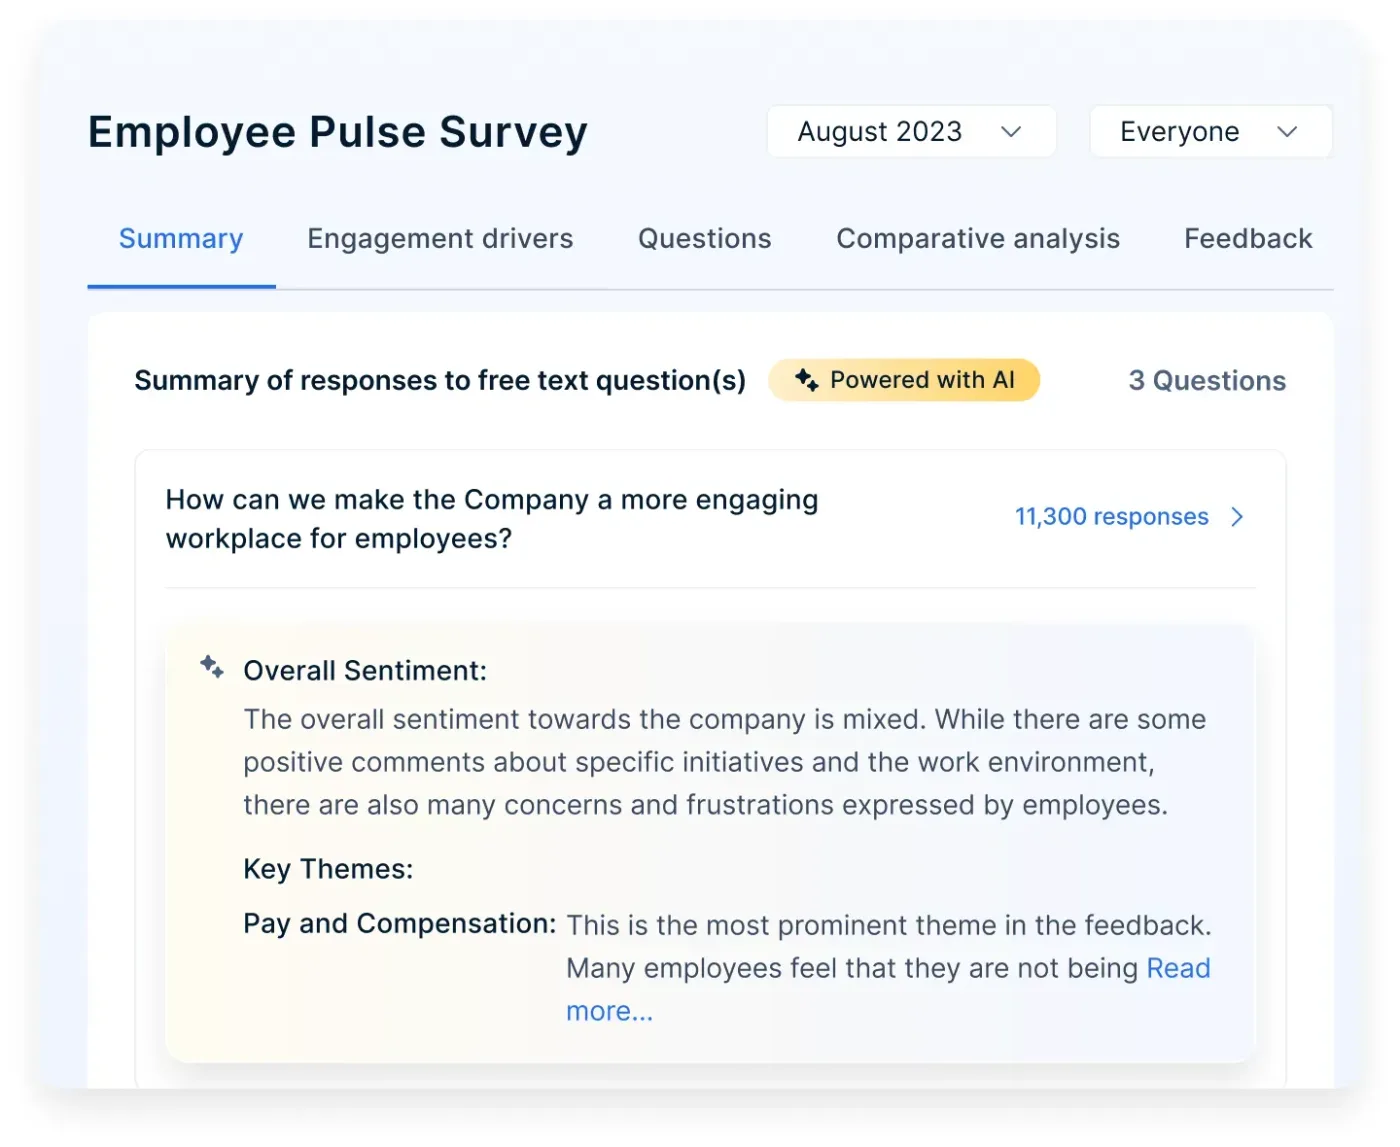
Reading hundreds of comments by hand is the step most teams skip. Tools that group open-text answers into themes and sentiment, such as AI-powered employee engagement surveys, make that step realistic for large organizations.
How to act on eNPS results
Acting on the results is the step that improves the score, and it is the one employees remember. The six actions below build a feedback loop; for a full playbook of tactics, read how to increase employee NPS.
- Develop action plans: Create specific, targeted plans for the issues with the biggest impact. If feedback points to career development, that might mean workshops, mentorship and clear progression paths, each with an owner and a deadline.
- Communicate changes: Tell employees what you heard and what will happen, with a timeline. Regular progress updates keep trust high between surveys.
- Foster a culture of continuous feedback: Make it easy to share ideas outside formal surveys through regular check-ins or an always-open digital feedback channel. A strong culture of feedback catches issues before they show up in the score.
- Monitor and adjust plans: Use the next eNPS survey to check whether the actions worked. If career development improves but work-life balance concerns remain, add initiatives such as flexible hours.
- Recognize and reward improvements: Celebrate teams that make real progress and share what they did, so other teams can copy it.
- Involve leadership: Senior leaders should champion the work, host town halls on progress and respond to concerns personally. Their involvement shows that engagement matters to the business.
For a template that assigns owners and timelines to each issue, use this employee engagement action plan guide.
eNPS in practice: examples from real organizations
eNPS works across industries and company sizes when it is part of a wider listening and action program. These three examples show different ways organizations have used it.
- Apple retail: Apple adapted the Net Promoter System for the employees in its retail stores, an approach Bain & Company calls Net Promoter for People. Store teams regularly gave feedback and ideas, and managers were expected to close the loop on them, treating employee loyalty the same way the company treats customer loyalty.
- ANCA Machine Tools: ANCA replaced manual, irregular recognition with Empuls and added integrated engagement and pulse surveys to see whether the change was working. It reached an 80% employee promoter rate and a 100% increase in engagement scores across its Asia operations, and used the survey results to refine its recognition program.
- A 10,000+ employee global enterprise: Moving from an annual survey to continuous listening with pulse and lifecycle surveys, delivered through WhatsApp and email, lifted survey participation from 39% to 88% and helped reduce voluntary attrition. Higher participation also makes every eNPS reading more reliable.
How Empuls helps you measure and improve eNPS
Empuls pulse surveys are built around the eNPS question. Each pulse pairs the 0 to 10 score with 15 follow-up questions that roll up into four engagement drivers (Strategic Connect, Hygiene Factors, Relationship and Culture, and Recognition and Career Growth), plus an anonymous open-text question. Surveys go out on a set weekly, monthly or quarterly cadence through Slack, Microsoft Teams or email, with automatic reminders and recipient lists synced from your HRIS.
Results show eNPS and driver scores by department, tenure, location and business unit, trended over six cycles and benchmarked against cross-industry norms. AI sentiment analysis groups comments into themes, and survey action plans give every insight an owner and a deadline, tagged to the driver it addresses. You can explore the dashboards in reports and analytics.
Make eNPS a habit, not a headline
Employee net promoter score is the simplest way to know whether your people would recommend you as an employer, and whether that is getting better or worse. Ask the same question on a steady cadence, add a follow-up that explains the score, segment carefully and check the margin of error before you react.
Above all, act on what you hear and tell employees what changed. That loop is what turns eNPS from a number on a dashboard into a more engaged, loyal workforce. To see where eNPS fits among other metrics, read how to measure employee engagement.
Book your Empuls demo
Frequently asked questions
A good employee net promoter score is any positive score that keeps rising, and most HR teams treat +10 to +30 as good, +30 to +50 as very good and above +50 as excellent. BambooHR's 2026 Employee Happiness Index put the average at 40, so compare your result with your own history and your industry before deciding whether it is strong.
The eNPS formula is the percentage of promoters minus the percentage of detractors. Promoters answer 9 or 10 on the 0 to 10 recommendation question, and detractors answer 0 to 6. Passives, who answer 7 or 8, count in the total responses but not in either group. For example, 50% promoters and 15% detractors gives an eNPS of +35.
NPS measures how likely customers are to recommend your product or service, while eNPS measures how likely employees are to recommend your company as a place to work. Both use the same 0 to 10 scale, the same promoter, passive and detractor groups and the same calculation. eNPS is an internal people metric and should always be kept separate from customer scores.
Most organizations run an eNPS survey monthly or quarterly, and at least twice a year. Quarterly is a good default because it leaves time to act on feedback between cycles. Running it more often works only if employees see results and changes; otherwise participation and honesty drop. Keep the question and timing consistent so trends are comparable.
Yes. An eNPS score is negative when detractors outnumber promoters, and it can go as low as -100 if every respondent is a detractor. A negative score signals widespread dissatisfaction and higher attrition risk. BambooHR's 2026 data shows companies with a negative eNPS lose far more employees than those with an excellent score, so treat it as a priority.
Yes, eNPS surveys should be anonymous or at least confidential, because people are far more candid when they know answers cannot be traced to them. Explain who sees the results and report only groups above a minimum size, commonly five or more respondents. Anonymous open-text comments are often where the most useful feedback appears.
A response rate of 70% or higher is a strong result for an eNPS survey, and anything below about 50% makes the score less representative. Short surveys, mobile and chat delivery, automatic reminders and visible action on past results all lift participation. Low response rates in a specific team are a signal worth investigating on their own.
eNPS is a reliable measure of employee loyalty and a useful proxy for engagement, but it does not explain why people feel the way they do. It works best as a fast, trendable headline metric alongside driver questions on managers, growth, recognition and workload, plus open comments. Together they show both the level of engagement and what to fix.