Key Takeaways
Incentive calculation in Excel works best when deals, plan rules, calculations and statements live on separate sheets and formulas never contain typed numbers.
Lookup tables with XLOOKUP, SUMIFS and SUMPRODUCT replace fragile nested IFs and make tiered incentive formulas easy to check.
The biggest Excel incentive risks are manual data entry, formula errors, weak audit trails and the inability to share pay data safely at scale.
Control totals, a change log and a second reviewer before every payout catch most spreadsheet incentive errors.
When three or more warning signs appear, such as multi-day data prep, regular corrections and many plans, automated incentive software usually costs less than the spreadsheet.
Incentive calculation in Excel works well for a few reps on a simple plan: keep sales data in a structured table, keep rates and tiers in a separate lookup table, and calculate payouts with formulas such as XLOOKUP, SUMIFS and SUMPRODUCT. It starts to break as reps, plans and data sources multiply. This guide covers the 11 most common problems, a practical Excel fix for each, and the signs that it is time to move to software.
Incentive calculation in Excel is the practice of using spreadsheet formulas to turn sales data and incentive plan rules into each person's payout. Whether you manage sales commissions, employee bonuses or other incentives, Excel can simplify the process, but like any tool it has limits, and knowing them is what keeps your payouts accurate.
Why Excel is still the default for incentive calculation
Excel has dominated the spreadsheet market since the 1990s, and it remains a powerful tool for financial and commission calculations. There are good reasons it is the first tool most teams reach for:
- It is versatile: One workbook can hold data, rules, calculations and reports.
- It makes data collation easy: Exports from almost any system open in Excel.
- It summarizes and visualizes data: Pivot tables and charts turn results into reports quickly.
- It supports powerful formulas: Lookups, conditional sums and array formulas cover most plan logic.
- It is used across the world: Almost everyone in sales operations and finance already knows it.
That familiarity explains why so many companies still run incentives this way. Everstage's 2026 research on the hidden cost of spreadsheets, a survey of 400+ RevOps and sales compensation leaders at US and UK B2B software companies, found that 60% still run commissions on homegrown spreadsheets. The cost shows up in accuracy and trust, as CaptivateIQ's 2026 State of Incentive Compensation Management Report of 200 compensation leaders shows:
60%
of companies
still run commissions on homegrown spreadsheets (Everstage, 2026)
64%
of companies
had a payout error in the past year (CaptivateIQ, 2026)
93%
of companies
get rep questions about payouts every pay period (CaptivateIQ, 2026)
Spreadsheets, payout errors and rep questions in 2026
How to build an Excel incentive calculator the right way
Most Excel incentive problems start with how the workbook is built, not with the math. Before you look at the 11 problems below, set up the workbook in four separate parts so that data, rules and results never mix:
- Deals sheet: One row per deal (or per rep credit on a split deal), formatted as an Excel table, with deal ID, rep, close date, amount, split % and status.
- Plan sheet: Rates, tier thresholds, quotas and the payout curve in small lookup tables. Change a rate here and every formula picks it up.
- Calculation sheet: One row per rep, using only formulas that reference the deals and plan sheets. No typed numbers.
- Statements and checks: Per-rep statements, control totals and a change log that records who changed what and why.
With that structure in place, these formulas cover the most common incentive calculations. They use Excel table references (such as Deals[Amount]), which expand automatically as you add rows:
| Task | Excel formula | What it returns |
|---|---|---|
| Credited sales per rep for the period | =SUMIFS(Deals[Credit],Deals[Rep],[@Rep],Deals[CloseDate],">="&PeriodStart,Deals[CloseDate],"<="&PeriodEnd) | Total credited sales for each rep, where Credit = Amount × Split % |
| Attainment | =[@Sales]/[@Quota] | 1.15 (115%) for $230,000 against a $200,000 quota |
| Rate for an attainment band (retroactive tiers) | =XLOOKUP([@Attainment],Tiers[Min],Tiers[Rate],,-1) | The rate of the highest band the rep reached |
| Marginal tiers (10% to $50,000, 12% to $100,000, 15% above) | =SUMPRODUCT((B2>{0,50000,100000})(B2-{0,50000,100000}){0.1,0.02,0.03}) | $15,500 for $130,000 of sales |
| Payout curve with threshold, accelerator and cap | =[@Target]MIN(2,IF([@Attainment]<0.5,0,IF([@Attainment]<=1,[@Attainment],1+([@Attainment]-1)1.5))) | $13,000 for 120% attainment on a $10,000 target |
| Flag reps missing from the plan table | =IFNA(XLOOKUP([@Rep],Plan[Rep],Plan[Quota]),"MISSING") | "MISSING" instead of a silent error |
| Control total | =IF(ABS(SUM(Calc[Payout])-SUM(Statements[Payout]))>0.01,"CHECK","OK") | "CHECK" when statements and calculations disagree |
Two notes on the formulas. The marginal tier formula uses differential rates (10%, then 2% and 3% more), so each band adds only its extra rate: $130,000 × 10% + $80,000 × 2% + $30,000 × 3% = $15,500. XLOOKUP needs Excel for Microsoft 365 or Excel 2021 and later; in older versions, use INDEX and MATCH with an approximate match on a sorted table. For the plan logic behind these formulas, see how to calculate sales commissions and how to calculate sales incentives.
Outgrowing your incentive spreadsheet?
Keep the formula flexibility, lose the copy-paste, nested IFs and payout errors.
Talk to our ExpertTrusted by 5,000+ companies
11 common problems with incentive calculation in Excel and how to fix them
Spreadsheets were built to automate calculations with more math than logic, while incentive plans are more logic than math. The 11 problems below are ordered roughly from daily friction to structural limits, and the first two, manual work and human error, cause the most payout mistakes.
1. Manual and time-consuming
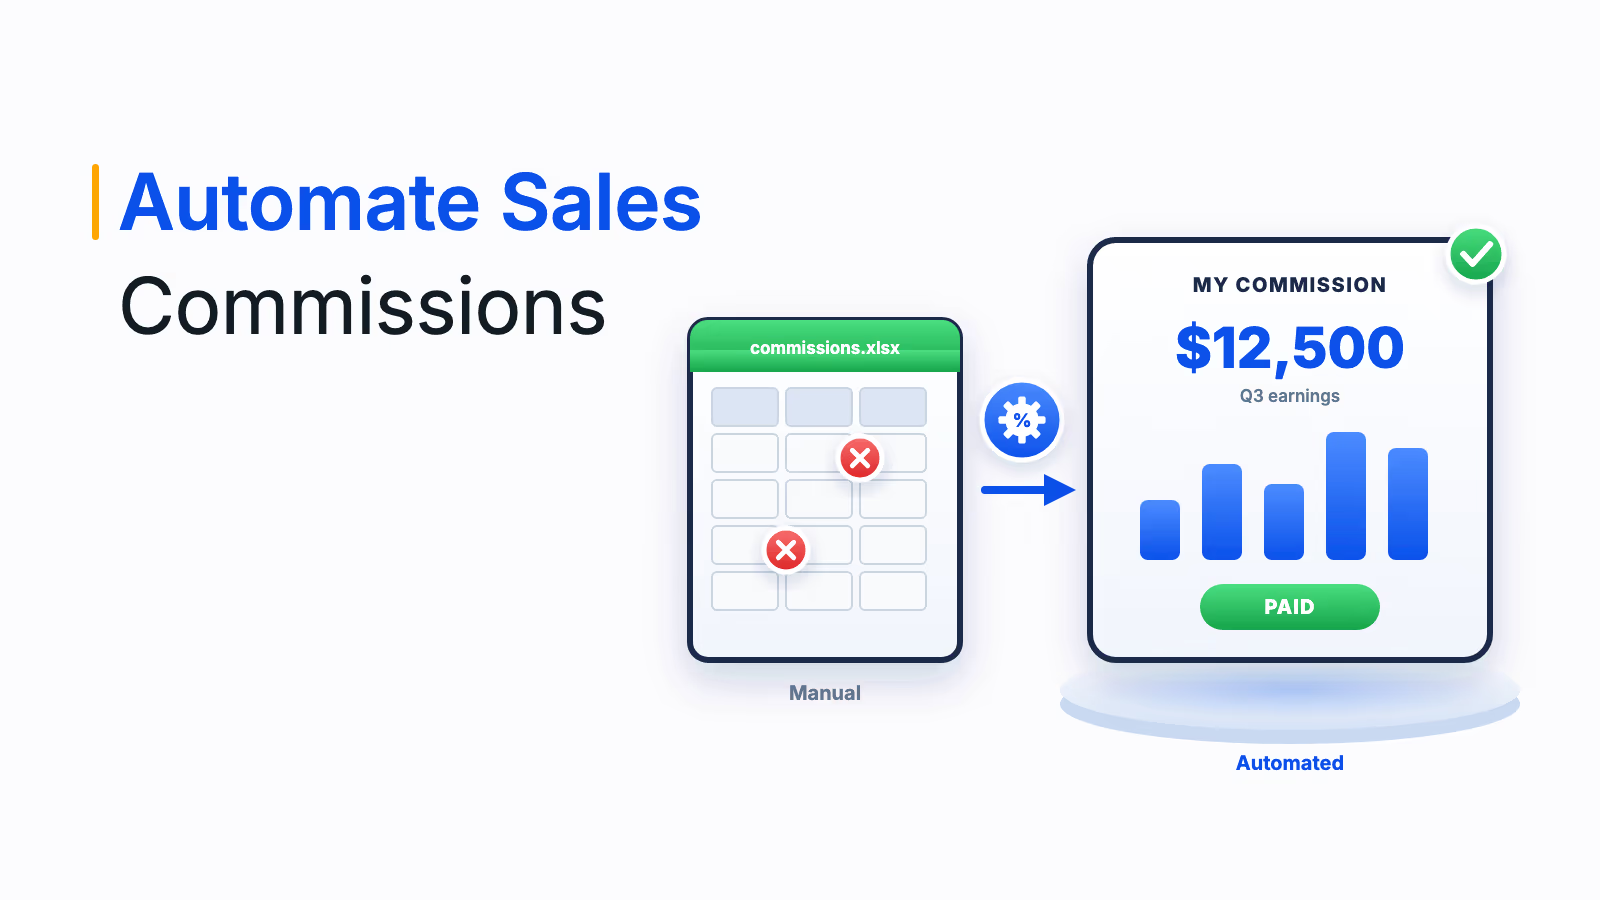
Excel does not pull data from your CRM or ERP on its own, so data has to be exported, copied and pasted, or worse, typed in. That is manageable for a handful of reps, but as the rows and columns grow it becomes slow and leaves plenty of room for error.
Fix in Excel: Use Power Query (Data, Get Data) to import CRM and ERP exports into the deals table and clean them the same way every cycle with one Refresh. Never paste data over formulas.
2. Prone to human error
Incentive calculation is more logic than math, which is exactly where spreadsheets are weakest. A business analyst ends up building a formula with dozens of lookups and nested IFs, and if one reference goes wrong, it is fatally easy for the error to skew the results and overpay or underpay your reps.
Fix in Excel: Keep every rate and threshold in the plan sheet, use data validation drop-downs for reps, plans and statuses, lock formula cells with sheet protection, and add control totals that compare the payout total with an independent calculation every cycle.
3. Lacks real-time visibility and transparency
Unless someone updates the workbook constantly, the data is out of date. Excel is not connected live to your CRM or ERP, so reps and managers cannot see where they stand mid-cycle, and the numbers they finally receive are hard to check.
Fix in Excel: Refresh on a fixed schedule, such as every Monday, and send each rep a read-only statement that shows every deal, rate and adjustment behind their number. Showing the math is the single best way to reduce disputes.
4. Not built for scale
Excel works well when the data runs to hundreds of records, can be entered or pasted by hand, and the logic is mostly mathematical. Organizations run into trouble when they try to build a full incentive system in Excel, with thousands of deals, many plans and complex rules. Workbooks slow down, files grow and every change takes longer to test.
Fix in Excel: Keep one row per deal, avoid volatile functions such as INDIRECT and OFFSET that recalculate constantly, and move large data sets into the Power Pivot data model. Remember that a worksheet holds at most 1,048,576 rows.
5. Expensive
Excel looks free, but incentive calculation in Excel consumes analyst, manager and finance time every cycle, and every error costs that time again, plus the overpayment or the trust lost through an underpayment. Everstage's 2026 research estimates that 25% to 40% of senior operations and finance time goes to the commission cycle.
Fix in Excel: Measure the real cost: hours per cycle multiplied by loaded hourly cost, plus the value of corrections. Then cut plan variants and standardize one template, because every extra plan multiplies the work.
6. Not auditable
Have you ever returned to an incentive sheet and found it was not how you left it, or overwritten a formula and seen errors spread across the sheet? Excel shows little about who changed which cell, when and whether they were approved to do it, and you cannot set up an approval chain inside the file.
Fix in Excel: Store the workbook in OneDrive or SharePoint so you can use Version History and Show Changes in Microsoft 365, add a change log sheet with date, owner, change and approver, and save a locked copy of each period's final file. These features help, but they show recent edits rather than a full audit trail, and they do not enforce approvals.
7. Not sharable
Sharing seems easy: attach the file to an email. But imagine 5,000 reps across 15 incentive plans, where team leaders should see their own team's incentives and no one else's. You can build the workbook, but you cannot divide and share it so each person sees only what they should.
Fix in Excel: Never email the master file. Generate one statement per rep from the calculation sheet, share them with individual permissions, and keep the master workbook restricted to the people who run the calculation. Incentive data is personal pay data, so treat access accordingly.
8. Does not integrate with your current systems
Complex incentive calculations need current data from CRM, ERP, HRMS and payroll. Extracting it from each system, working on it and keeping it up to date is slow, manual and error-prone.
Fix in Excel: Connect Power Query to the sources it supports, or to scheduled exports saved in one folder, so the same transformations run each time. Reconcile record counts and totals after every refresh to catch missing data early.
9. Not built for financial reporting and compliance
Excel follows a simple input, process and output model. It has no built-in way to handle tax rules by slab or country, and it keeps financial reporting separate from incentive calculation and payouts. Commission accounting adds another layer: under ASC 606 (ASC 340-40), US companies generally capitalize the incremental costs of obtaining a contract, such as commissions, and amortize them over the period of benefit.
Fix in Excel: Keep a separate, locked schedule that ties each commission to its contract and amortization period, and reconcile it with the general ledger every month. If finance spends days on this, it is a strong signal the spreadsheet has outgrown its job.
10. Cannot automate payments
Excel can produce the final number but cannot go a step further. To pay out, someone has to key the amounts into payroll, release bank transfers or order gift cards by hand, which adds new chances for error and delay.
Fix in Excel: Build an export sheet whose columns match your payroll system's import template exactly, and reconcile the payroll register against it after every run. Incentive software removes this step entirely; Empuls, for example, pushes approved incentives straight into payroll systems such as ADP, Workday and SAP SuccessFactors.
11. Not built for incentives
Excel is a two-dimensional blank canvas. Layers of incentive logic push you into 10, 20 or even 28 levels of nested IFs and lookups to reach one number, and if one of those levels is wrong, so is the payout.
Fix in Excel: Replace nested IFs with lookup tables and XLOOKUP, use IFS or LET to make long formulas readable, and keep one formula per column so every column does one job. If a rule cannot be expressed in a lookup table, document it in plain language next to the formula.
| Problem | Best Excel fix | Sign you have outgrown Excel |
|---|---|---|
| Manual work | Power Query imports and one-click refresh | Data prep takes more than a day each cycle |
| Human error | Lookup tables, validation, locked cells, control totals | Corrections after payout every cycle |
| No visibility | Scheduled refresh and per-rep statements | Reps track earnings in their own shadow sheets |
| Scale | One row per deal, no volatile functions, data model | Workbook takes minutes to recalculate |
| Cost | Measure hours and standardize one template | Several people spend days on each cycle |
| Audit | Version History, change log, locked period copies | Auditors or finance ask who changed a number and no one knows |
| Sharing | Individual statements, restricted master file | Hundreds of reps or several manager views |
| Integration | Power Query connections and reconciled counts | Data from three or more systems |
| Compliance | Separate locked ASC 606 schedule | Month-end close waits on the commission file |
| Payments | Export sheet matching the payroll template | Payouts in several countries or currencies |
| Plan logic | Lookup tables, IFS and LET instead of nested IFs | Formulas no one but the author understands |
When to move from Excel to an automated incentive system
You do not need to leave Excel the day you hire a fifth rep, but you should move when the warning signs in the table above start to stack up. Three or more of them usually means the spreadsheet costs more than software would. The full business case is in this guide to replacing Excel for commission calculation; if you decide to move, the transition takes seven steps:
- Understand the need for automation: List the errors, delays and disputes of the last few cycles so you know which problems the new system must solve.
- Choose the right platform: Look for flexible plan configuration, real-time dashboards, approval workflows, payroll integration and easy connection to your CRM and HR systems. These guides to the best sales commission software and best incentive management software can help you shortlist.
- Set clear rules and criteria: Write down every metric, rate, tier, gate and eligibility rule. Clear rules are what let the system calculate accurately.
- Integrate data sources: Connect sales, HR and payroll data so the system works from current numbers, not exports.
- Automate calculations and notifications: Run the system alongside your spreadsheet for one or two cycles, compare results, then switch it on fully, with notifications when reps hit milestones or earn incentives.
- Monitor performance and adjust: Use the platform's analytics to track participation, payout trends and plan effectiveness, and adjust plans with data.
- Train your team: Show reps, managers and finance how to read their dashboards and statements so they trust the new numbers.
How Empuls replaces incentive spreadsheets
Empuls includes sales incentive and commission software that keeps what people like about Excel, such as formulas and flexibility, and adds the data connections, controls and payouts a spreadsheet cannot provide. It serves finance, sales operations and HR in different ways.
For finance:
- Payroll integration: Approved incentives are pushed into payroll systems such as ADP, Workday and SAP SuccessFactors, with no manual entry. Where payroll is not the route, payouts can go by bank transfer, UPI or rewards.
- Multi-currency and tax compliance: Incentives are calculated in local currency across 50+ currencies, with regional tax logic applied in the payout.
- Audit and ASC 606: Every plan change, calculation run, approval and payout is logged, and commission records support ASC 606 accounting.
- Controls before payout: Multi-level approvals and anomaly checks run before money moves.
For sales operations and HR:
- No-code plan builder: Build commission, target and milestone plans with fields, functions such as MAX, FLOOR and ROUND, and IF, THEN and ELSE logic, without nested formulas.
- Validated data in: CRM, ERP and HRMS data is checked and standardized on the way in, so errors are caught at the source.
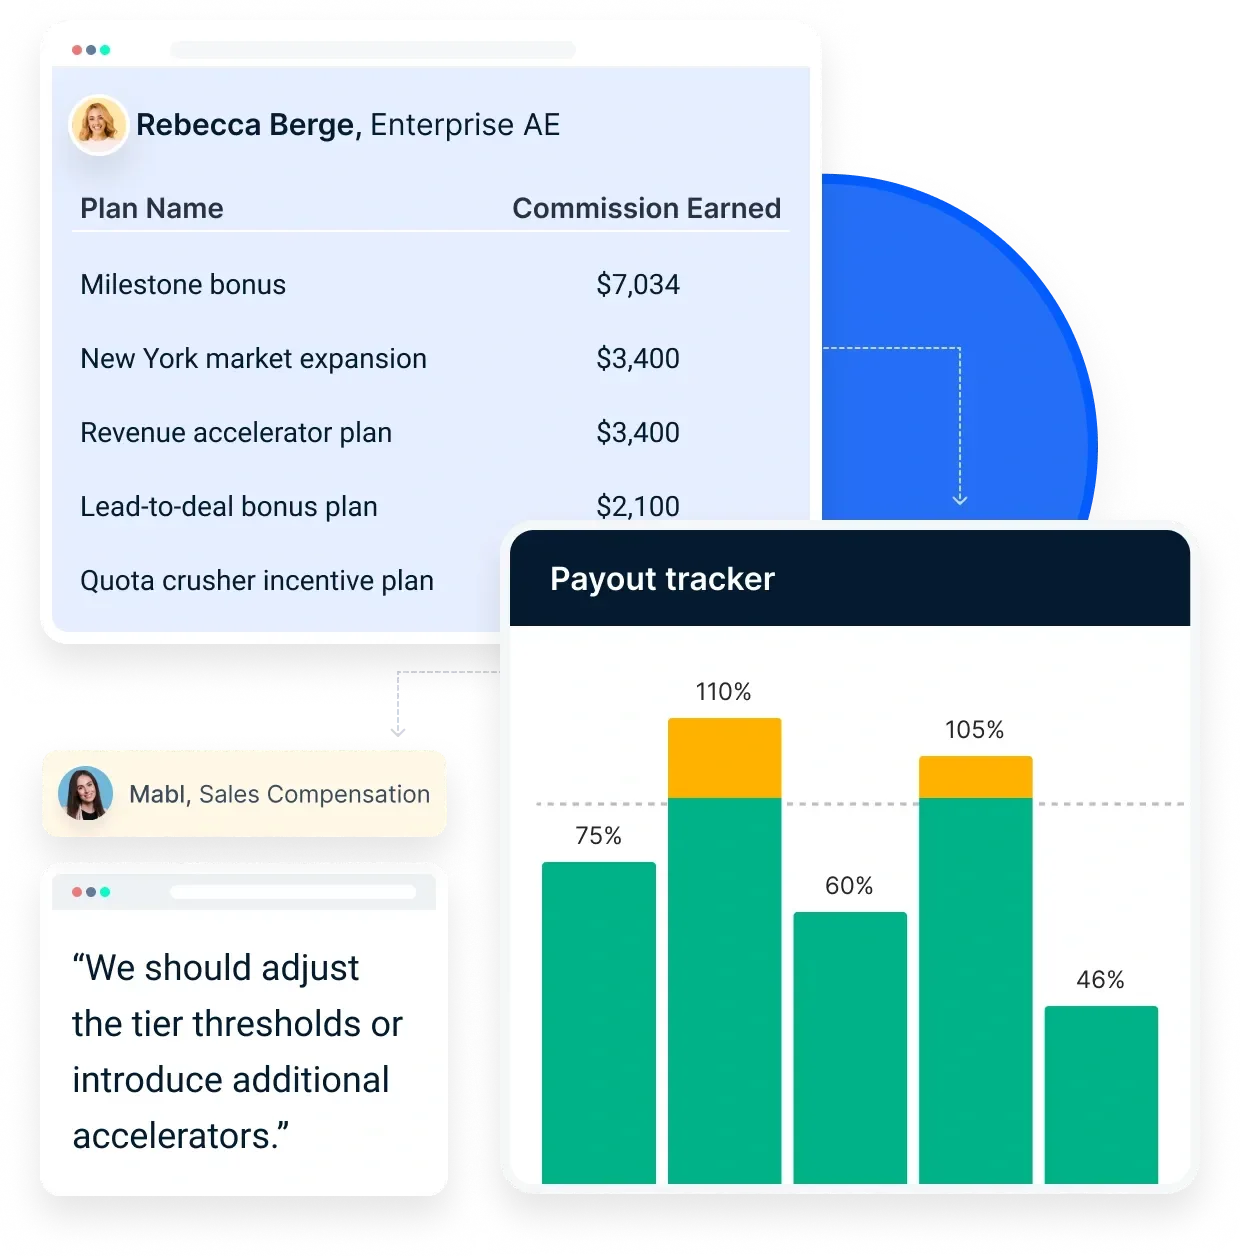
- Transparency for reps: Sales professionals see attainment and earnings in real time on web and mobile, which removes most payout queries.
- Plan effectiveness: Dashboards show payout trends and plan performance by team, region or plan, so you can adjust plans with data.
The difference is measurable. When Mahindra Finance moved incentives for 20,000+ sales professionals across 12 lines of business off manual processing, incentive processing became 99% faster and incentive queries to finance and HR fell by 85%, according to the Empuls sales incentives overview. To estimate your own savings, use the sales incentive ROI calculator.
Book your Empuls demo
Frequently asked questions
Put each rep's sales in one column and their target in another, calculate attainment with =Sales/Target, then look up the payout rate or percentage from a separate plan table with XLOOKUP. Multiply that by the sales amount or target incentive. Keeping rates in a lookup table means you change a rate once instead of editing every formula.
A common formula is incentive = (actual performance − threshold) × incentive rate, paid only when performance exceeds the threshold. In Excel, write it as =IF(B2>C2,(B2-C2)*D2,0), where B2 is actual sales, C2 the threshold and D2 the rate. For $130,000 of sales, a $100,000 threshold and a 10% rate, the incentive is $3,000.
For marginal tiers, where each rate applies only to sales within its band, use SUMPRODUCT with differential rates: =SUMPRODUCT((B2>{0,50000,100000})*(B2-{0,50000,100000})*{0.1,0.02,0.03}). This returns $15,500 for $130,000 of sales. For retroactive tiers, where one rate applies to all sales, look up the rate with XLOOKUP and multiply it by total sales.
Use XLOOKUP if you have Excel for Microsoft 365 or Excel 2021 or later. It looks left or right, defaults to an exact match and, with a match mode of -1, returns the next smaller value, which suits tier tables. In older versions, use VLOOKUP with TRUE for an approximate match or INDEX and MATCH, and keep the tier table sorted in ascending order.
A common form is incentive pay = base pay + (sales achievement × commission rate). It means total pay combines a fixed salary with variable earnings tied to performance. For example, $4,000 of monthly base pay plus 5% of $60,000 in sales gives $4,000 + $3,000 = $7,000 for the month.
Separate data, plan rules and calculations onto different sheets, keep every rate in a lookup table, lock formula cells and use data validation for inputs. Add control totals that compare payouts with an independent calculation, log every manual change, and have a second person review the largest and smallest payouts before each payout run.
There is no universal figure. Set the percentage from the plan's goals: decide the variable pay you want someone to earn at 100% of target, then divide it by their target or base. Roles with more direct influence on revenue usually carry a larger variable share. Model the cost at 80%, 100% and 150% attainment before you launch.
Move to incentive software when data prep takes more than a day each cycle, corrections are needed after most payouts, reps keep their own shadow spreadsheets, you run many plans or pay in several countries, or month-end close waits on the commission file. Three or more of these signs usually mean the spreadsheet costs more than software.