Key Takeaways
Almost every quoted loyalty figure comes from a vendor surveying its own customers. Use them to locate yourself, never to set targets.
Around a quarter of earned points are never spent and roughly a tenth expire. That is liability and dormancy, not saving.
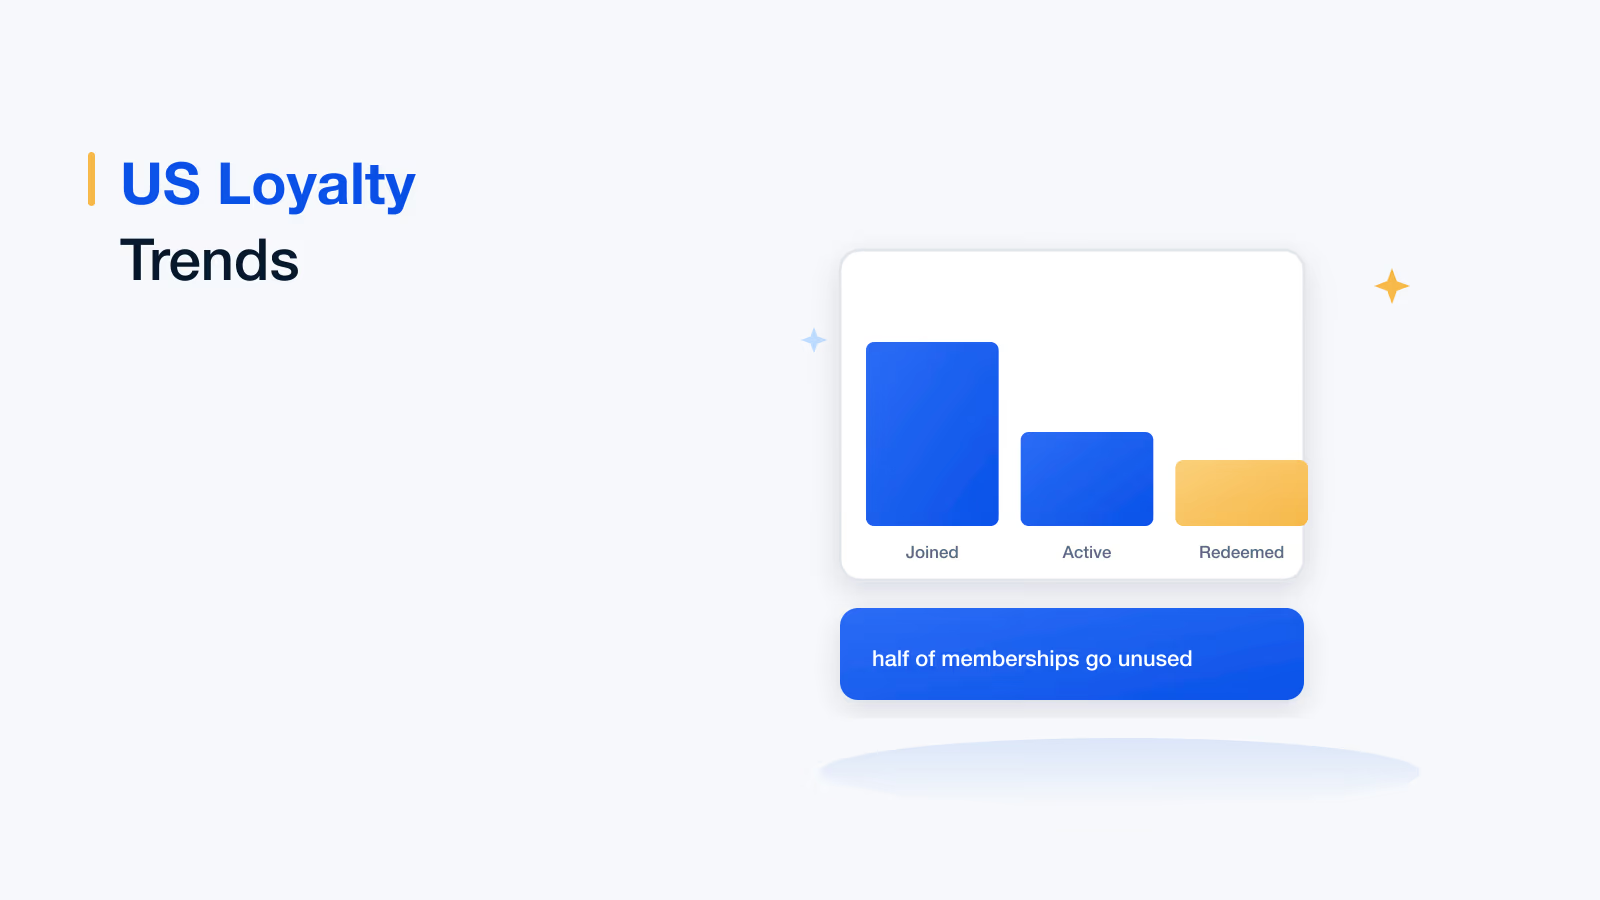
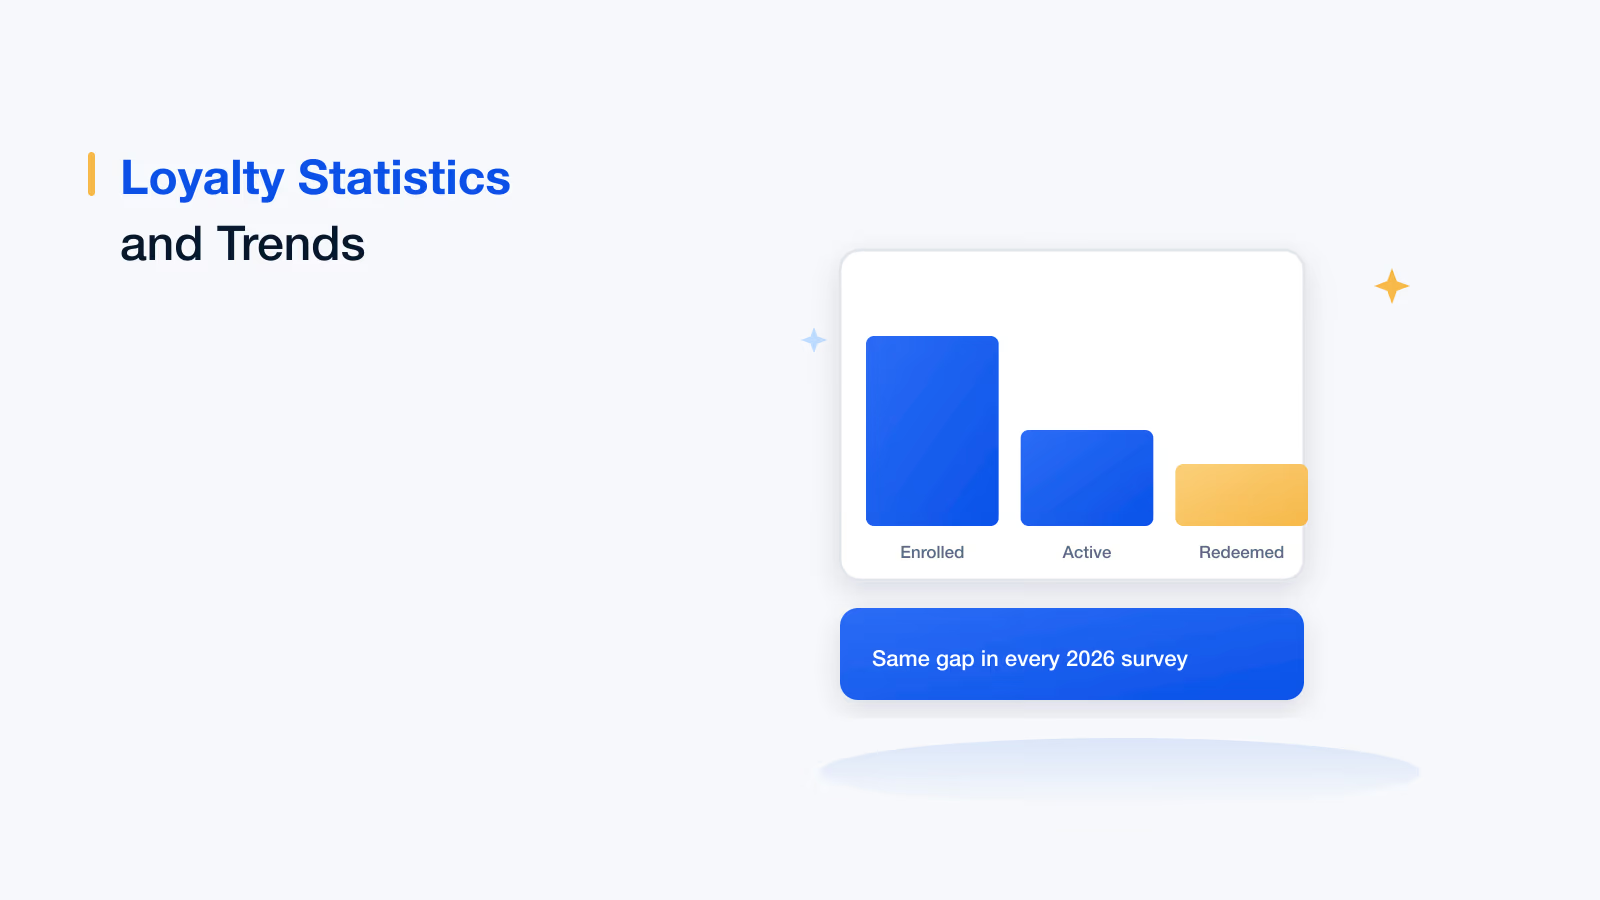
Every 2026 source, with different samples and definitions, finds the same gap: enrolment is high and about half of memberships are inactive.
Distrust any ROI figure. They are self-reported by operators, unaudited, and subject to heavy survivorship bias.
An uplift measured against non-members is self-selection. Without a holdout it is not a programme effect.
Your own redemption rate, active share and incrementality number are worth more than every published benchmark combined.
Loyalty statistics have a credibility problem. Almost every widely quoted figure originates from a vendor surveying its own customers, the definitions differ between sources, and the numbers are repeated across aggregator blogs until they acquire an authority nothing in the original methodology supports.
That does not make them useless. Used carefully, they are good for locating yourself roughly, for spotting direction of travel, and for seeing which assumptions are no longer safe. They are bad for setting targets and worse for business cases.
This guide sets out what the 2026 data actually says, where the figures come from, which ones to distrust, and what the numbers imply for how a programme should be designed.
How to read loyalty statistics
- Most are vendor-run surveys: Including nearly all the ROI figures, which are self-reported by programme owners rather than audited.
- Definitions vary enormously: Membership, active membership and enrolment are counted differently by almost every source, which is why figures disagree by a factor of two.
- Aggregators repeat each other: The same original study resurfaces across dozens of posts, which creates an appearance of consensus from a single sample.
- Survivorship is built in: Operators with failing programmes are less likely to respond to a survey about programme performance.
- Direction beats magnitude: The year-on-year movement in a consistently run survey is far more reliable than its absolute level.
5.3x
Reported average programme ROI
Antavo 2026, self-reported
~25%
Of points never spent
Antavo 2026
~50%
Of memberships actively used
consistent across sources
Participation and membership
The consistent finding across every 2026 source is that enrolment is high and active use is roughly half of it. Estimates of how many programmes the average consumer belongs to range from about eight to more than seventeen depending on sampling and definition, and the disagreement itself is the useful signal: nobody has a reliable count, but everybody finds the same activity gap.
- Appetite is rising: Antavo's 2026 report found 43.2% of consumers were more likely to join a programme than in the previous year.
- Programmes influence choice: Bond's consumer research reports that a large majority say a programme makes them more likely to keep buying from a brand, and a smaller majority say they spend more because of one.
- Programmes are seen as normal: Antavo reports roughly two thirds of consumers saying loyalty programmes are genuinely part of their lives.
- The gap is the opportunity: Half of memberships going unused is the single largest addressable number in the sector.
Redemption and liability
This is where the data is most actionable. Antavo's 2026 reporting puts roughly a quarter of earned points as never spent, with somewhere around a tenth expiring outright, and estimates the unspent value in the billions of dollars annually in the US alone.
For an operator those are not savings. Unredeemed points are a balance-sheet liability and a direct signal that members cannot reach a reward they consider worth having. Programmes with high breakage are usually not profitable programmes, they are dormant ones.
| Finding | Source | What it implies |
|---|---|---|
| Around a quarter of points never spent | Antavo 2026 | Reduce time to first redemption and widen redemption routes |
| Roughly a tenth of points expire | Antavo 2026 | Reconsider hard expiry in favour of activity-based rules |
| Half of memberships inactive | Multiple 2026 sources | Report active share, not enrolment |
| Reported ROI above five times | Antavo 2026, self-reported | Useful as direction, unusable as a target |
| Majority say programmes raise spend | Bond consumer research | Directionally supportive, not an incrementality measure |
Measure your numbers, not the industry's
Active share, time to first redemption, liability and holdout incrementality, reported continuously.
Book a demoTrusted by 5,000+ companies
Technology and AI adoption
Reported AI use in loyalty programme management rose sharply in 2026 surveys, with around half of loyalty marketers saying they use it somewhere, up by roughly a third year on year. The adoption number is less useful than the application: the uses with evidence behind them are next-best-offer selection, churn prediction, anomaly detection and liability forecasting.
Treat the adoption statistic as a signal about competitive expectation rather than a recommendation. Our guide to AI in loyalty programs covers where it pays and where it does not.
What consumers say they want
- Practical value first: 2026 consumer research consistently ranks removal of everyday friction, such as free or faster delivery, above aspirational rewards.
- Flexibility at redemption: Choice of how to take value is a stronger preference signal than the size of the value.
- No unpleasant surprises: Expiry and devaluation are the most complained-about mechanics in every consumer survey that asks.
- Recognition, not just discount: Status and access score well above their cost in perceived value.
- Relevance over volume: Irrelevant offers are consistently cited as a reason for disengaging rather than unsubscribing, which makes the damage invisible.
The trends the data supports
These are the trends with actual evidence behind them rather than the ones most often asserted. All six point back to the same gap between joining a programme and using it.
Shorter distance between earning and using
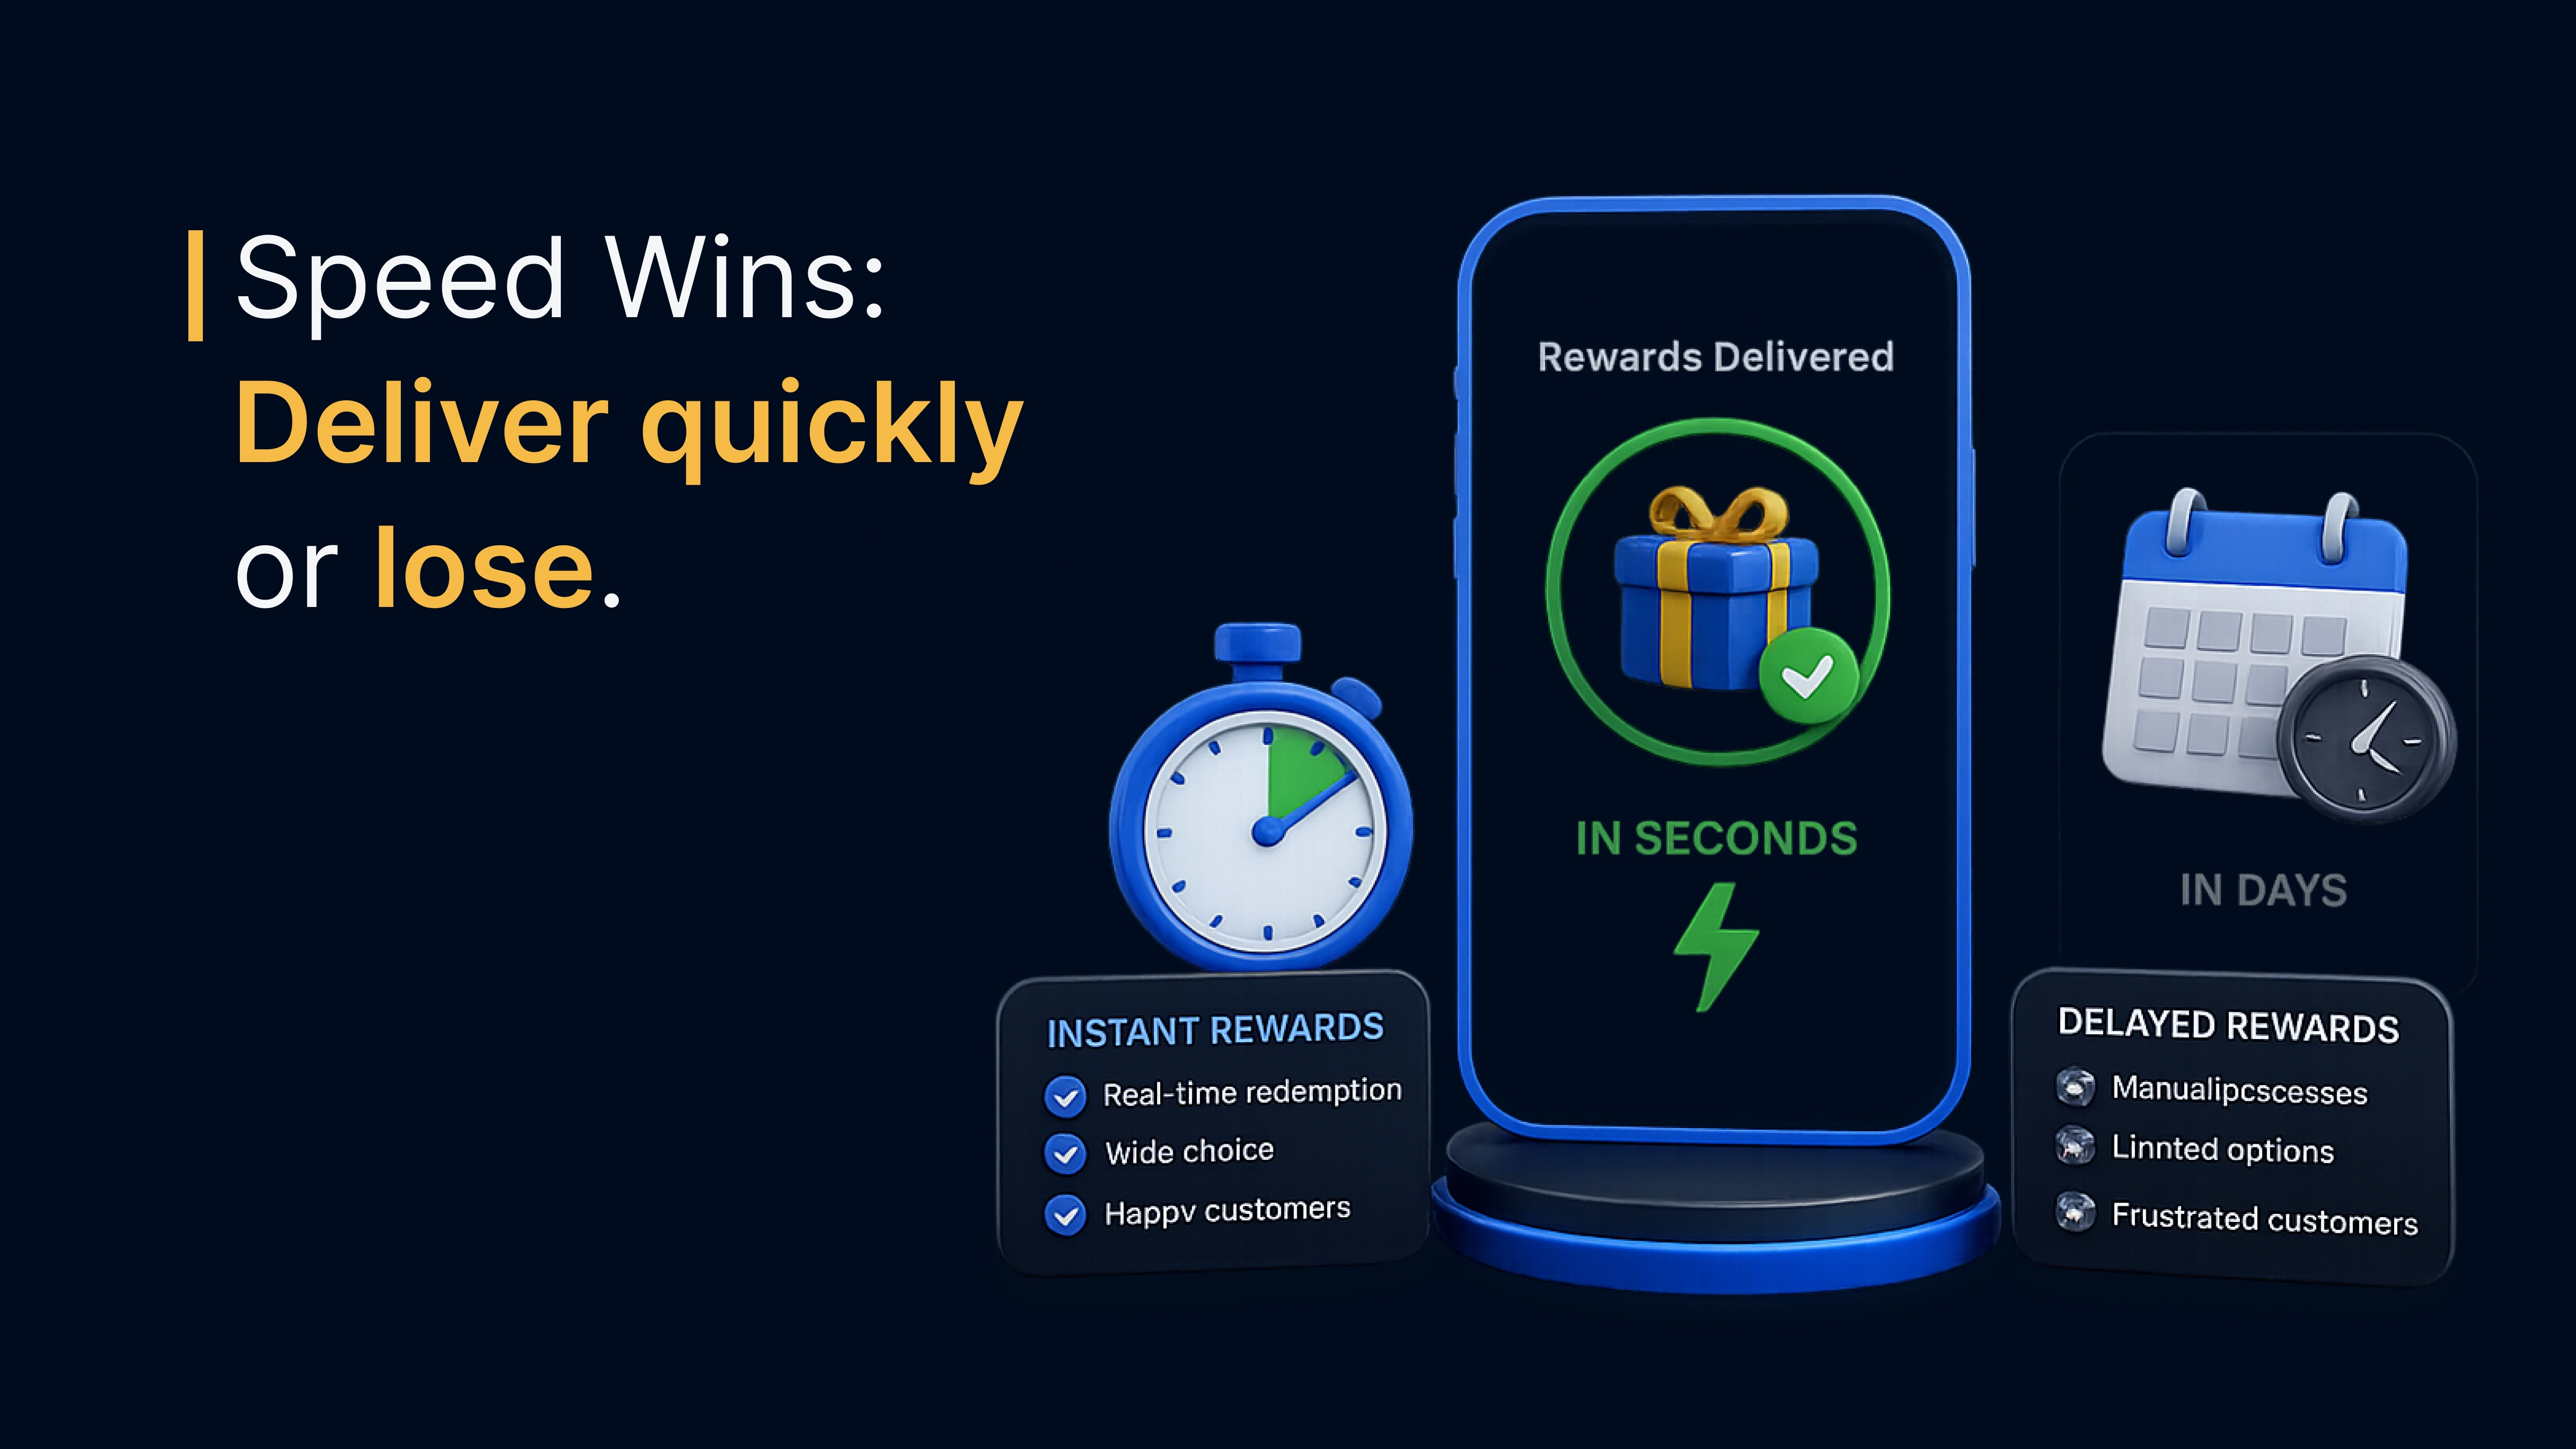
Every reliable finding points the same way: the programmes that work compress the gap between earning something and using it. This is the common root of the redemption, liability and active-share numbers.
Earning beyond purchases
Reviews, referrals, profile data and app actions. The evidence here is indirect but consistent, since programmes with broader earning show higher active share, which is precisely the metric the sector is short of.
Flexible redemption and points as currency
Part-payment at checkout, cash back, charitable donation and partner transfer all raise redemption rate, which simultaneously lowers liability and raises engagement.
Activity-based rather than hard expiry
Given that around a tenth of points expire and expiry is the most resented mechanic in consumer research, this is one of the clearer design implications in the whole data set.
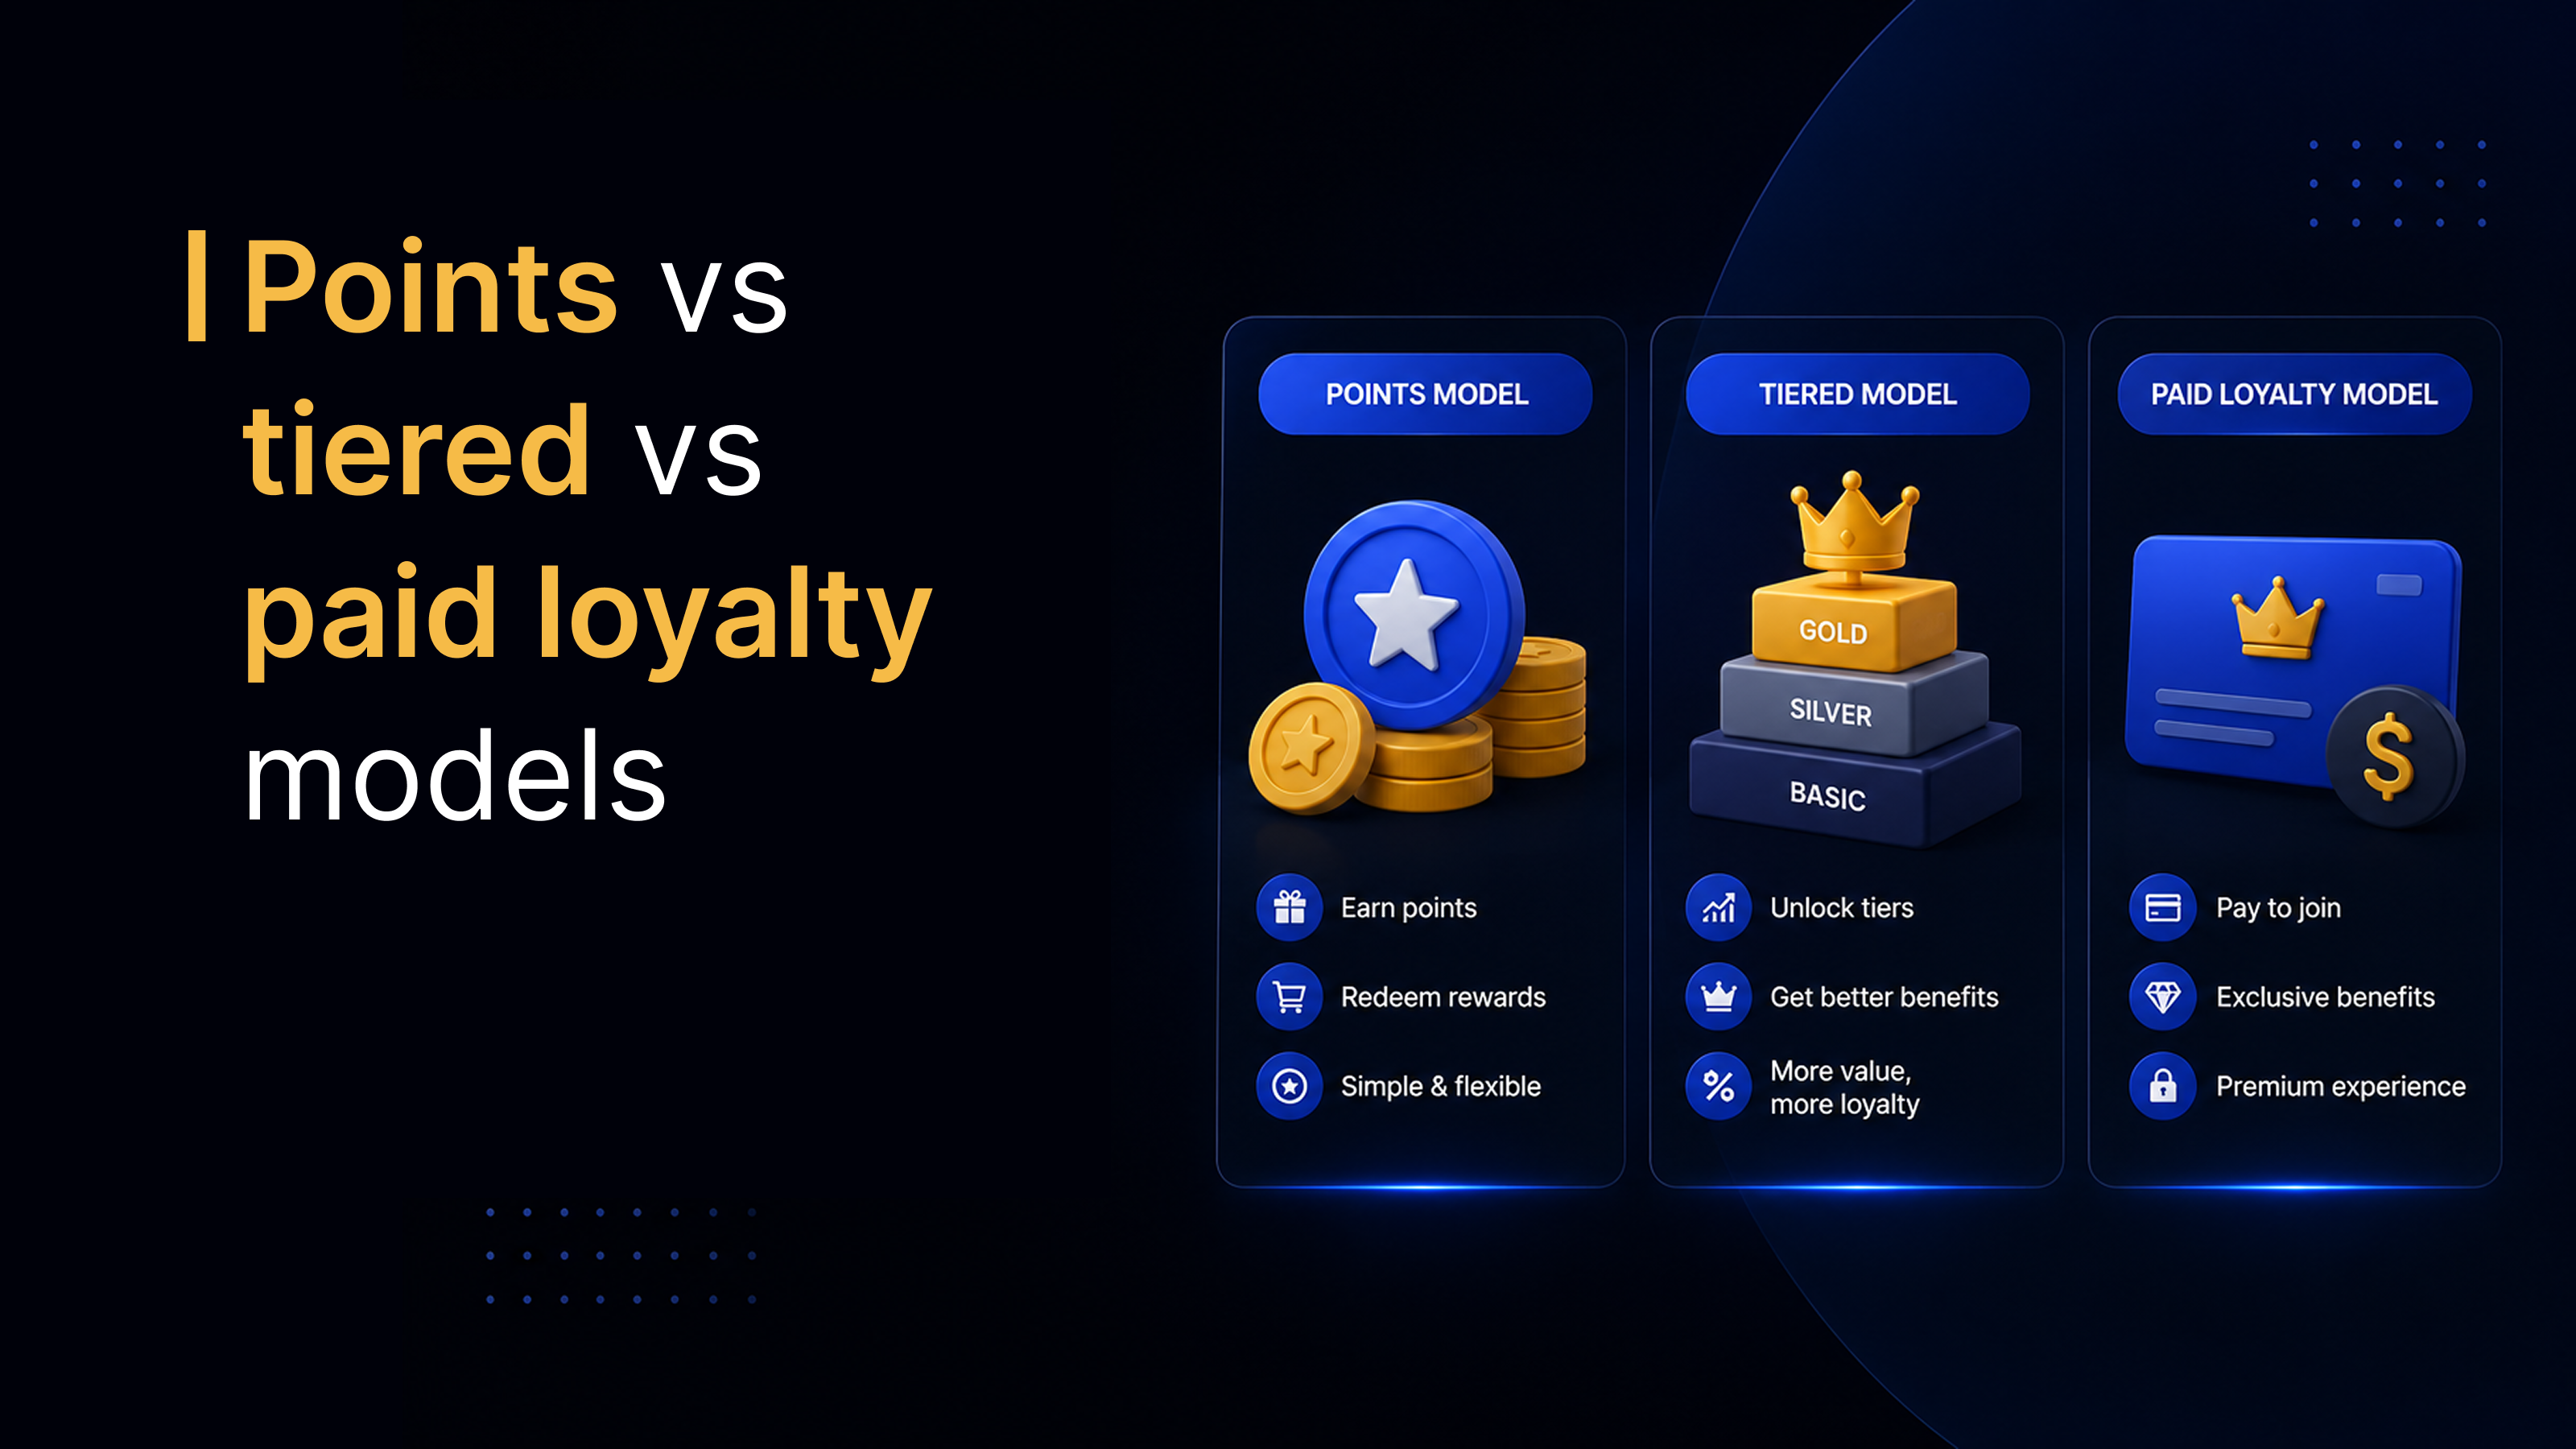
Paid tiers alongside free ones
Subscription and paid membership have grown fastest in categories with high visit frequency, because a fee pre-commits the customer and makes revenue predictable.
Personalisation under tighter privacy constraints
Consumer expectation of relevance has risen at the same time as privacy regulation and consumer rights have tightened. Both trends are real and they pull against each other, which makes consent quality a competitive asset rather than a compliance cost.
Which statistics to distrust
- Any ROI figure: Self-reported by operators, with no audit and heavy survivorship bias.
- Cost-to-acquire versus cost-to-retain ratios: The famous multiples trace back to decades-old studies with narrow samples and are quoted far outside their original context.
- Percentage-uplift claims with no control group: An uplift measured against non-members is self-selection, not programme effect.
- Membership counts without an activity definition: They vary by a factor of two between sources for exactly this reason.
- Any figure without a named, dated original source: If the chain ends at another blog, it is not evidence.
How to use statistics properly
- Use them to locate, not to target: Direction and rough position, never a number to be held to.
- Trace every figure to the original report: If you cannot, do not put it in a business case.
- Prefer your own data: Your redemption rate and active share matter more than any industry average.
- Compare within your segment: Sector, basket size and purchase frequency change every benchmark materially.
- Watch the year-on-year movement: A consistently run survey's trend is more reliable than its level.
- Build the control group: Your own incrementality number is worth more than every published statistic combined.
Measuring what actually matters
| Metric | Why it beats a benchmark |
|---|---|
| Active member share | Your own activity gap, measured consistently |
| Time to first redemption | The lever behind most of the sector's weak numbers |
| Redemption rate | Yours, not an average of incomparable programmes |
| Points liability and breakage | A real balance-sheet number rather than a survey response |
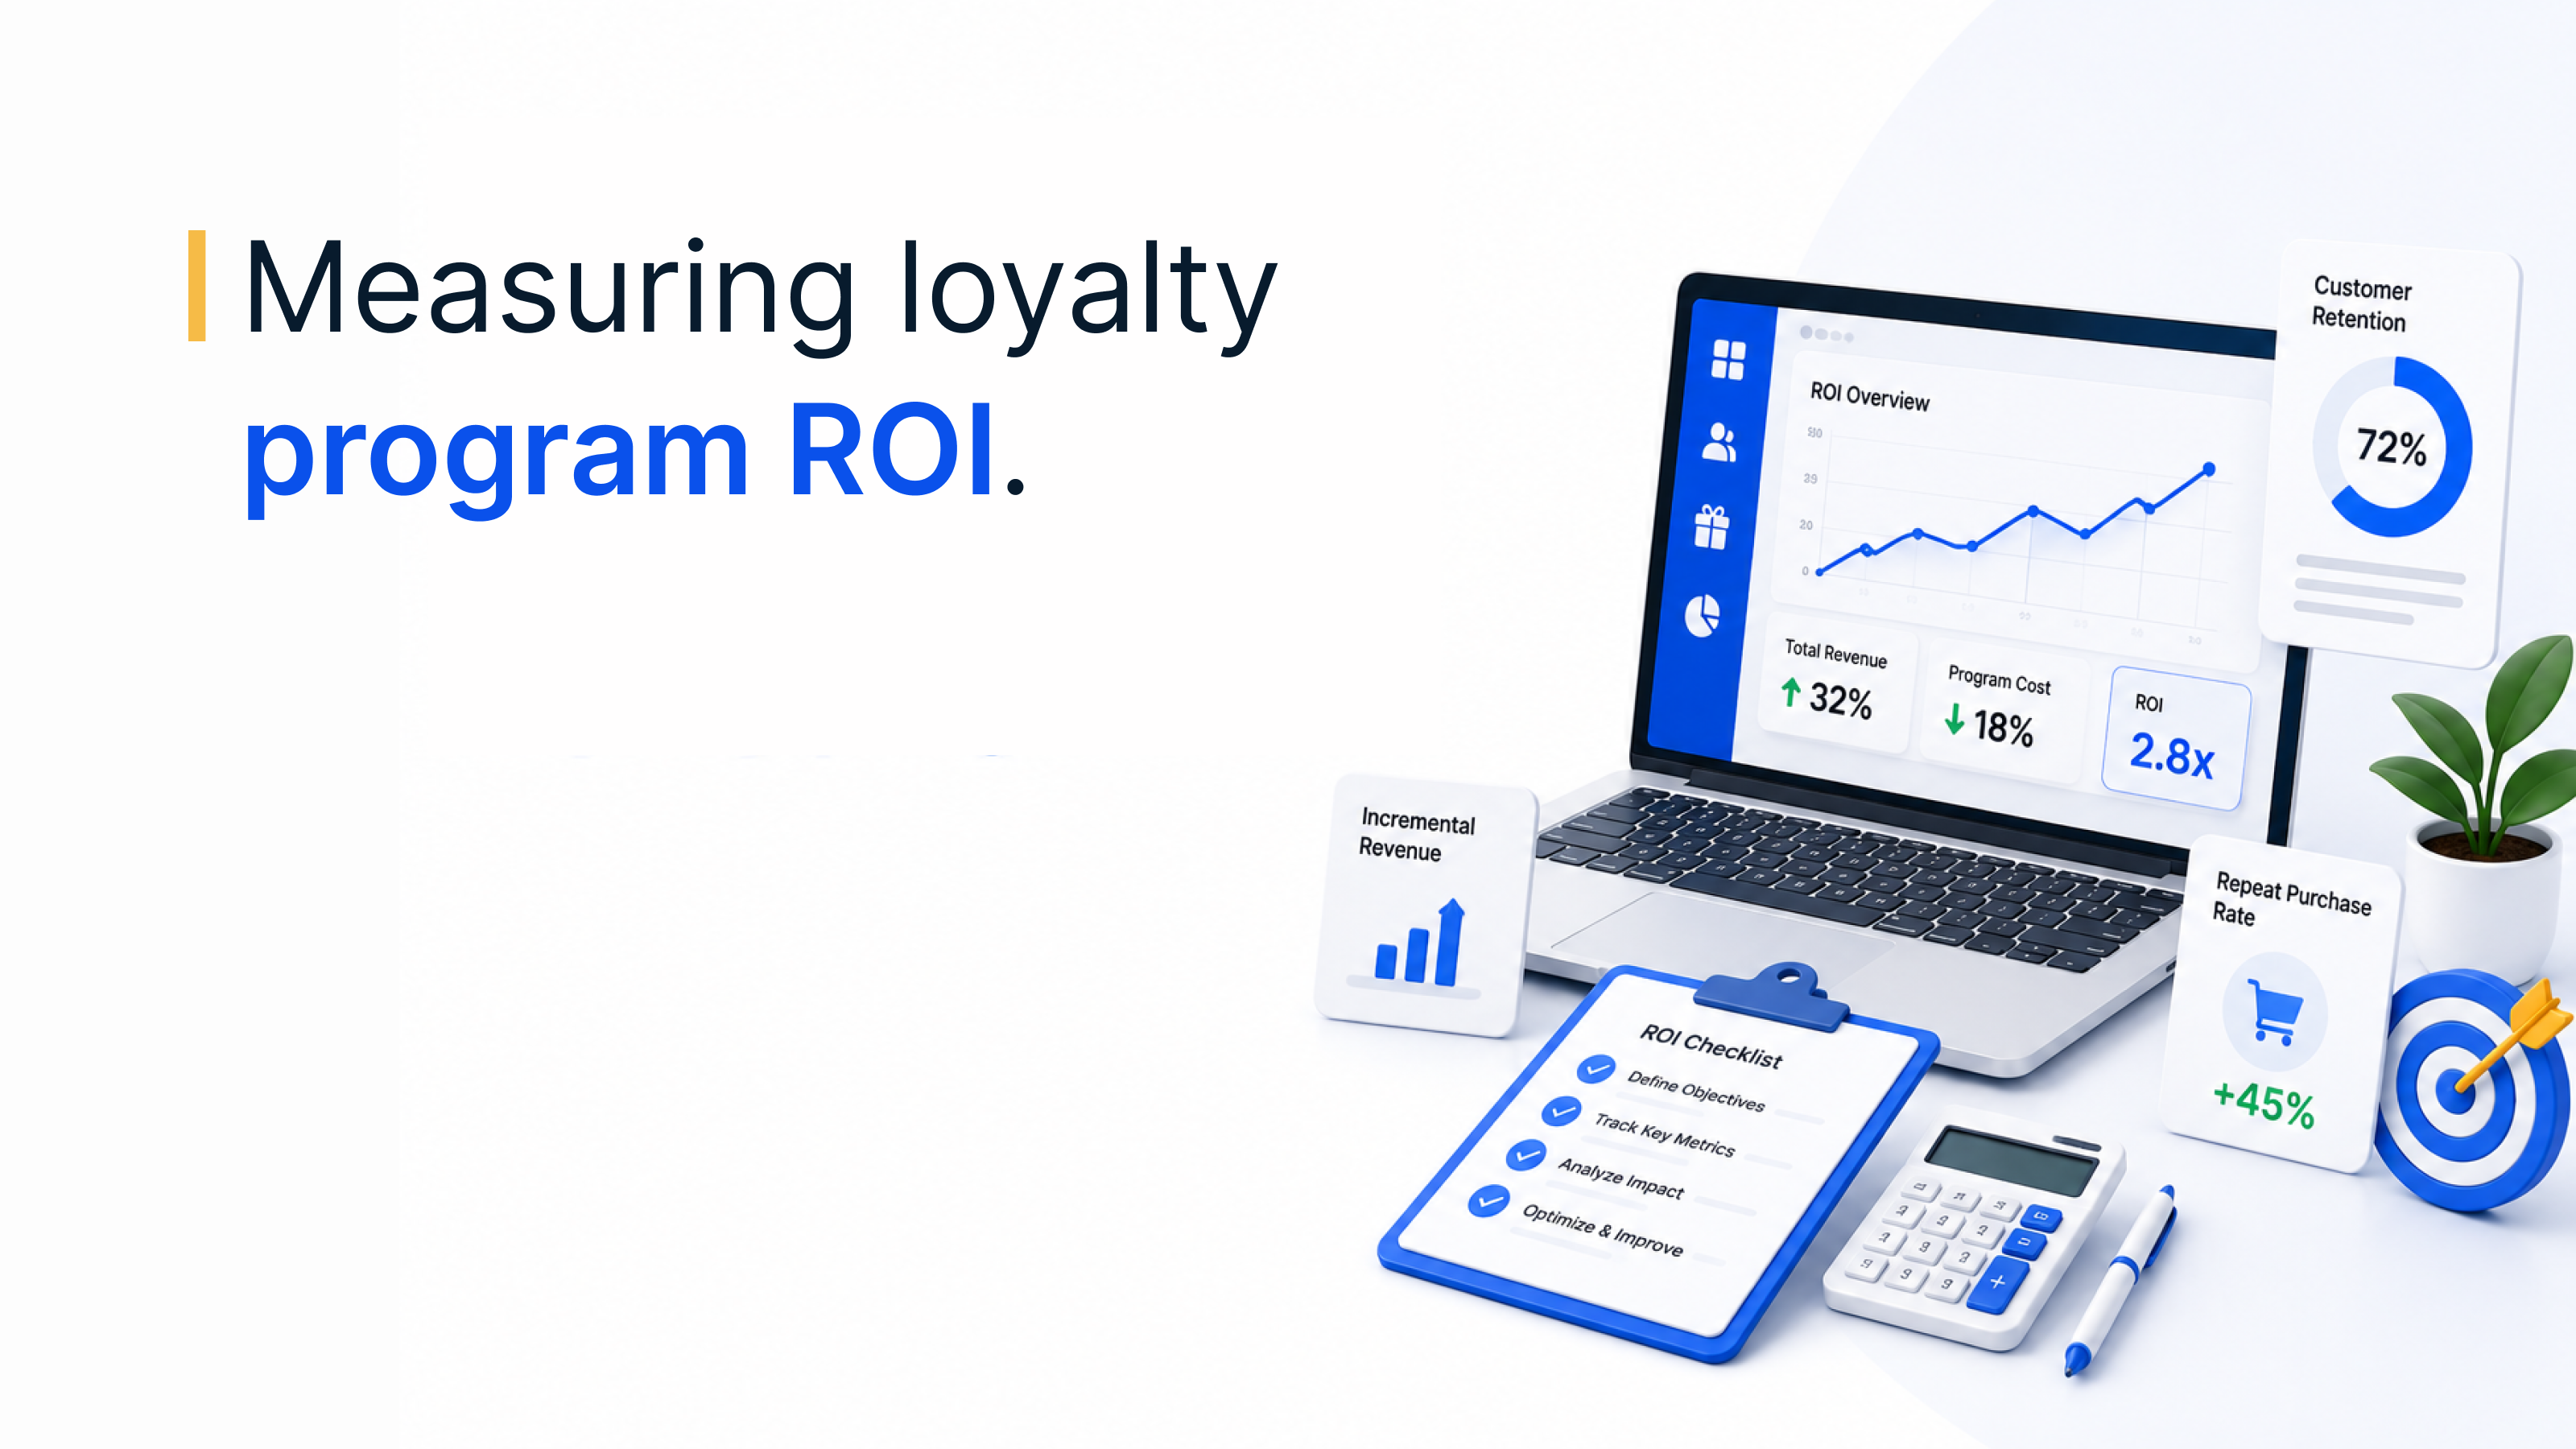
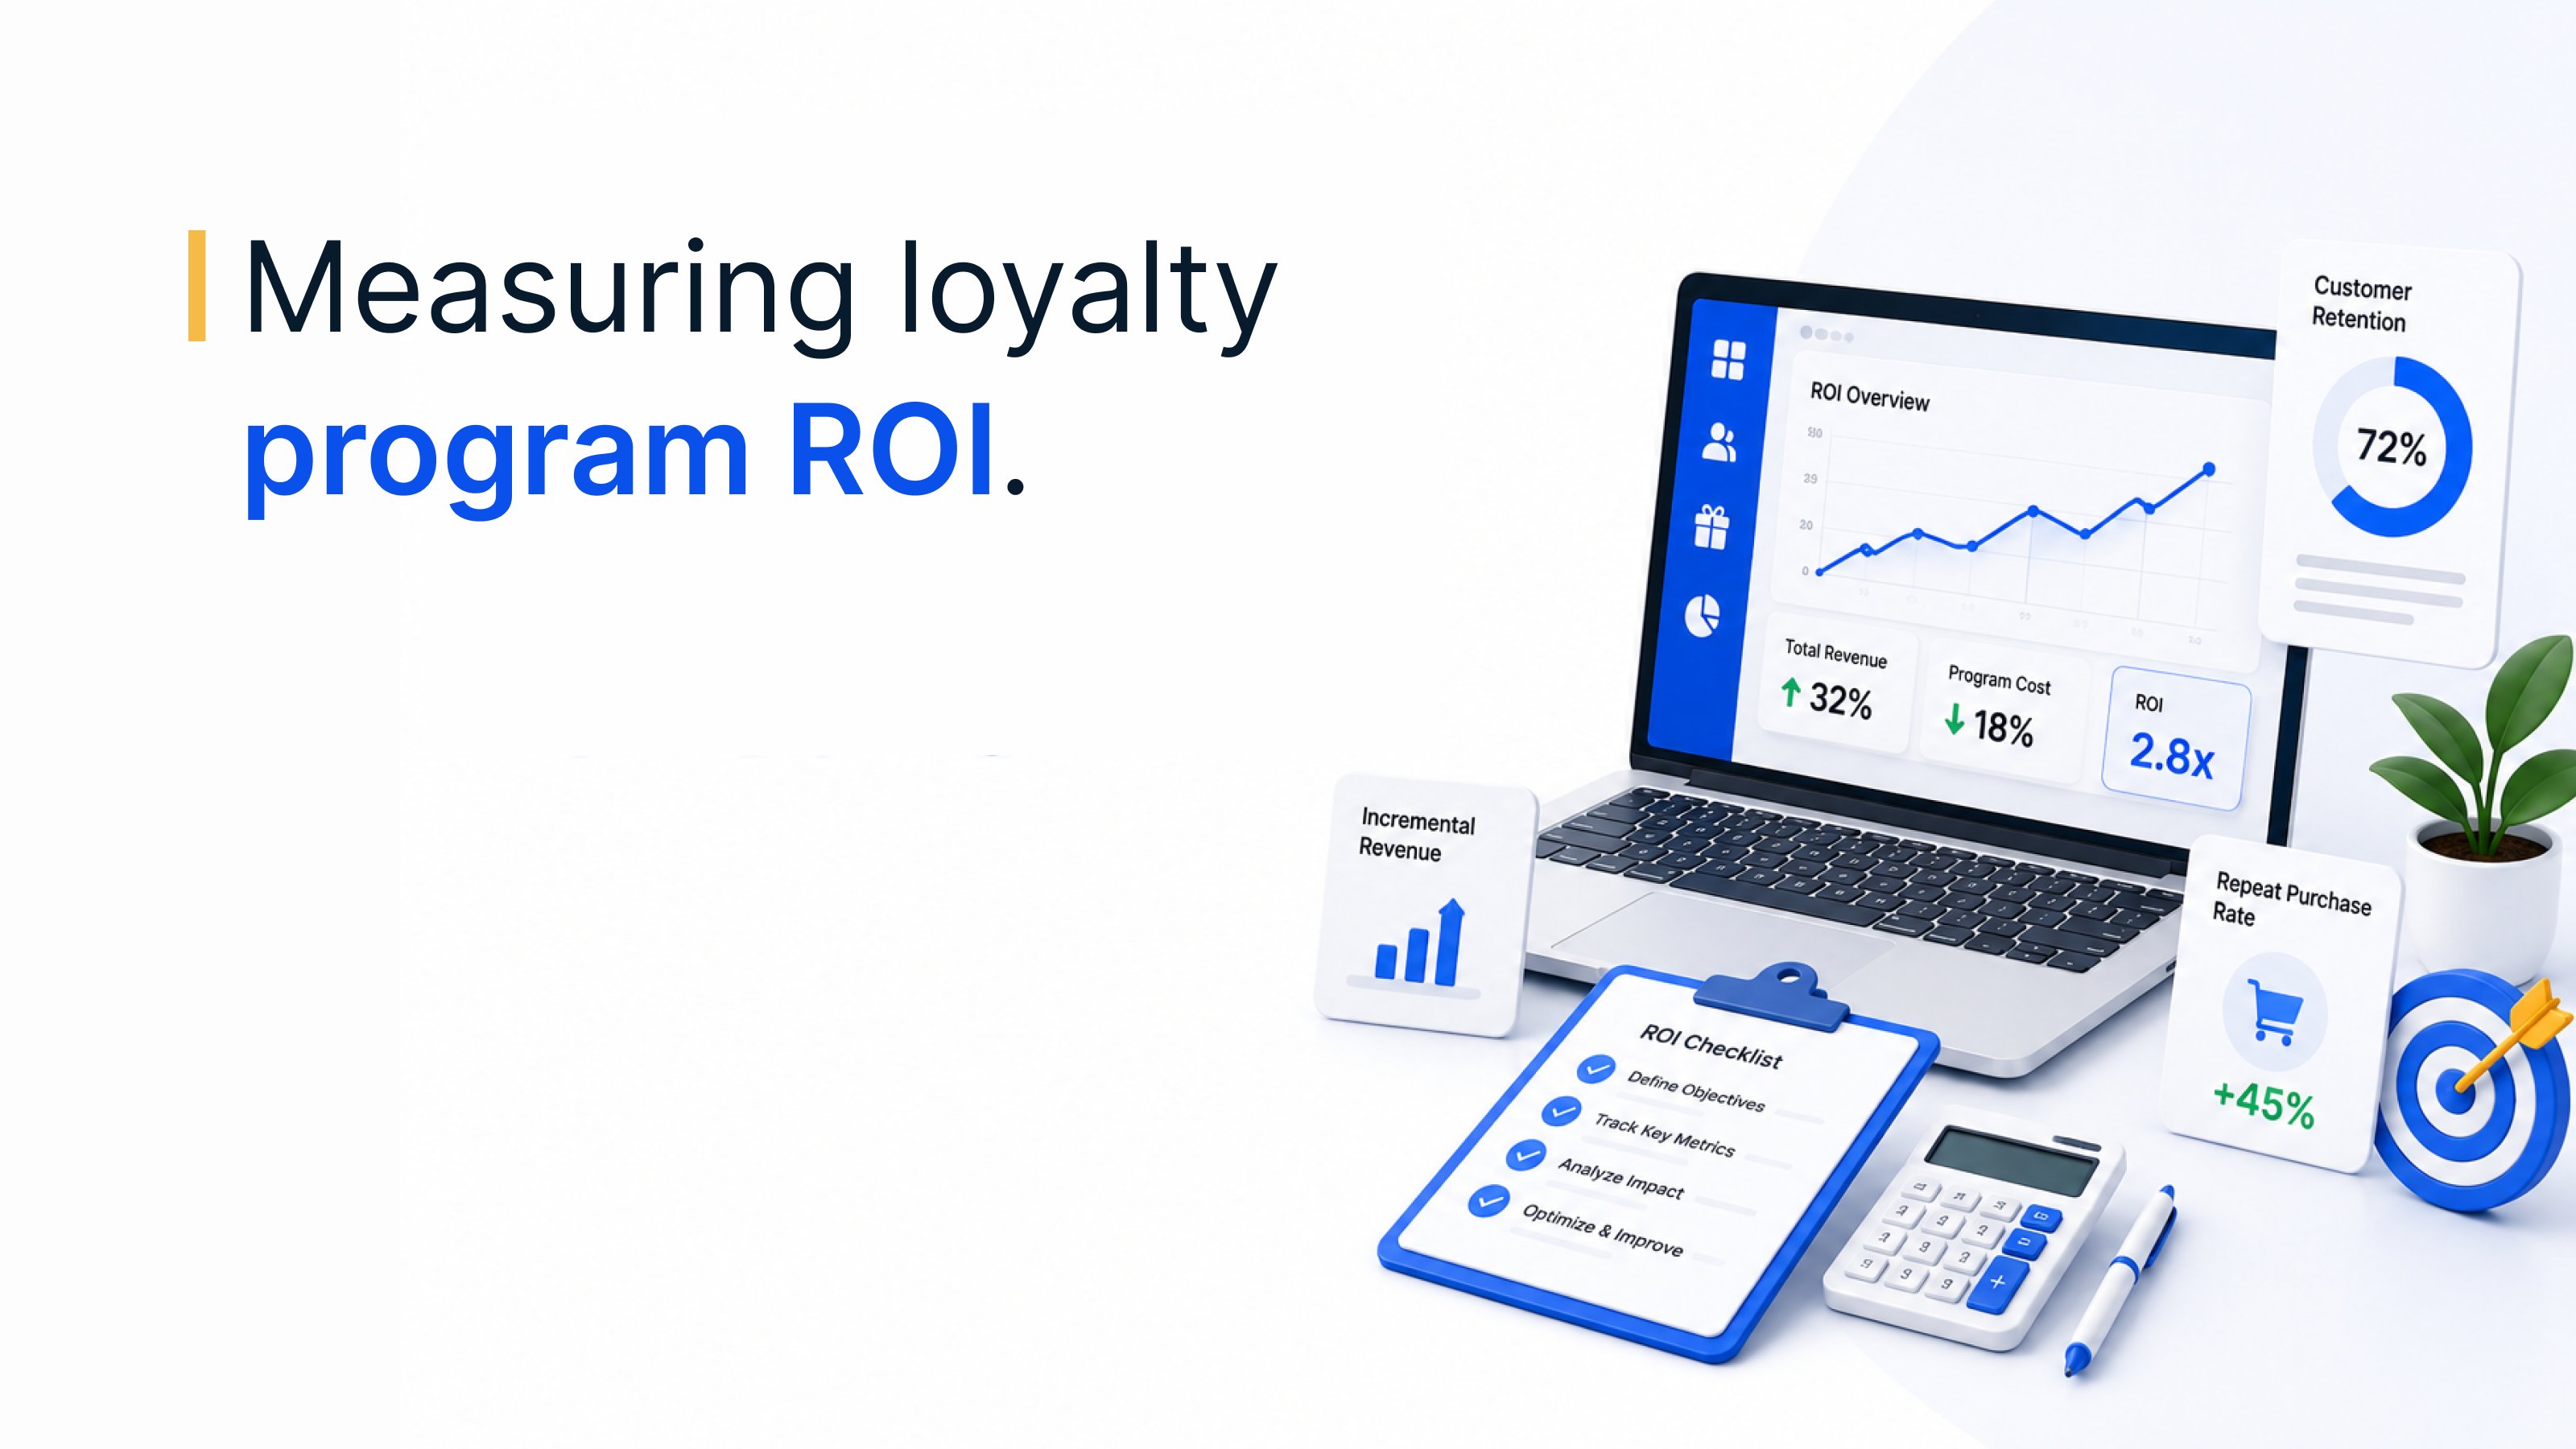
| Incremental revenue vs holdout | The only figure that proves causation in your business |
| Reward cost per unit of behaviour | What the programme costs to buy what it buys |
Loyalty measurement on Loyalife
01 · Activity
Active share, not enrolment
Member activity reported continuously, which is the number every industry statistic says is the real problem.
02 · Redemption
Time to first redemption
The distance between earning and using, tracked per cohort so it can actually be reduced.
03 · Finance
Liability and breakage
Outstanding value and breakage variance in the form finance expects, rather than a survey estimate.
04 · Flexibility
Broad earn and burn
Earning beyond purchases and redemption beyond a catalogue, which is what the data says raises active share.
05 · Expiry
Activity-based rules
Points that persist while the member is active, instead of the hard expiry consumers resent most.
06 · Proof
Holdout measurement
Your own incrementality number, which is worth more than every published benchmark.
You can also explore loyalty programs and the Loyalife platform.
The most useful thing in the 2026 loyalty data is not any single figure. It is that every source, with different samples and different definitions, finds the same gap between joining and using. That gap is where the work is.
Book your Loyalife demo
Frequently asked questions
Treat them as directional. Nearly all widely quoted figures come from vendors surveying their own customers, including the ROI numbers, which are self-reported by programme owners rather than audited. Definitions of membership and activity differ by source, aggregator blogs repeat the same original study until it looks like consensus, and operators with failing programmes are less likely to respond.
Antavo's 2026 reporting puts roughly a quarter of earned points as never spent, with somewhere around a tenth expiring outright, and values the unspent total in the billions of dollars annually in the US. For an operator that is not a saving. It is a balance-sheet liability and a signal that members cannot reach a reward worth having.
Around half of the memberships they hold, which is the one finding every 2026 source agrees on despite using different samples and definitions. Estimates of total memberships per consumer range from about eight to more than seventeen, and that disagreement is itself informative: nobody has a reliable count, but everybody finds the same activity gap.
Antavo's 2026 report puts the reported average at around 5.3 times, its third consecutive annual increase, with a large majority of measuring operators reporting a positive return. The figure is self-reported by programme owners responding to a loyalty vendor's survey and is not independently audited, so it is useful as direction and unusable as a target.
Any ROI figure, given self-reporting and survivorship bias. The famous cost-to-acquire versus cost-to-retain multiples, which trace back to decades-old narrow studies quoted far outside their context. Percentage uplift claims with no control group, which measure self-selection. Membership counts without an activity definition. And anything whose source chain ends at another blog.
Compress the distance between earning and using, which is the common root of the redemption, liability and active-share findings. Broaden earning beyond purchases. Offer flexible redemption including part-payment at checkout. Replace hard expiry with activity-based rules, since expiry is both common and the most resented mechanic. And treat consent quality as a competitive asset.
2026 surveys report around half of loyalty marketers using AI somewhere in programme management, up by roughly a third year on year. The adoption figure says more about competitive expectation than about effectiveness. The applications with real evidence are next-best-offer selection, churn prediction, anomaly detection and liability forecasting, all of which require clean identity data first.
Your own active member share, time to first redemption, redemption rate, points liability and breakage variance, reward cost per unit of behaviour bought, and above all incremental revenue against a matched holdout group. One properly constructed incrementality number from your own base is worth more than every published statistic in the sector.